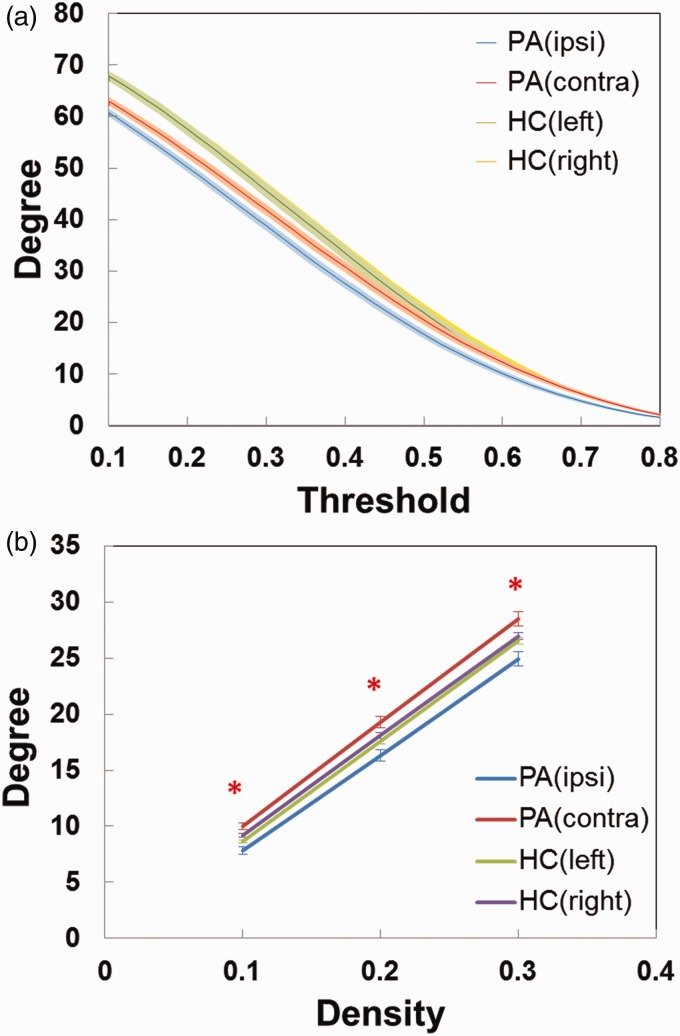
Figure 2.
(a) The relationship between the r threshold and the mean degree of functional connectivity in either hemisphere of the patients and normal controls. The solid line represents the averaged values across subjects, and the light-colored area indicates the range of one standard deviation. (b) The mean degree of functional connectivity in either hemisphere of the patients and normal controls at three density levels (0.1, 0.2, and 0.3) by node-based analysis. The solid line represents the averaged values across subjects, and the error bar indicates the range of one standard deviation. The red asterisks represent significant differences (p < 0.05) from paired t-tests in patients between ipsi- and contra-lateral hemispheres. (Ipsi: ipsilateral to stenosis; Contra: contralateral to stenosis; PA: patients; HC: healthy controls).

