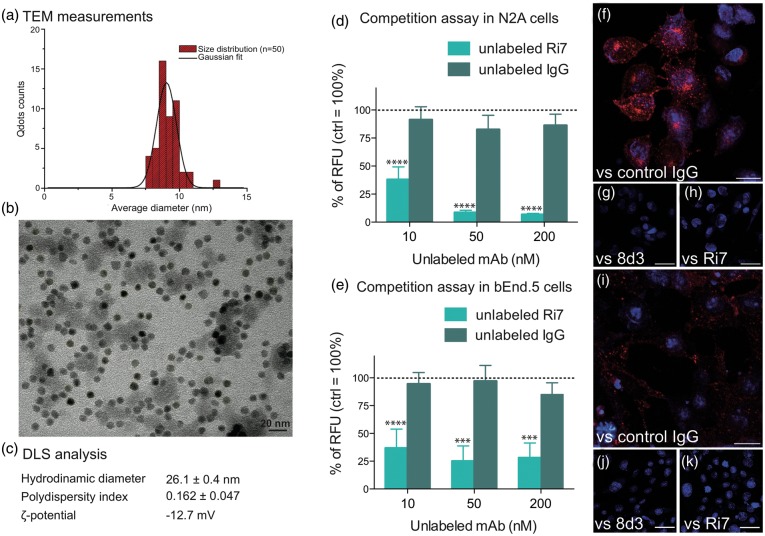
Figure 1.
Characterization of Ri7-Qdots complexes and in vitro TfR-specific internalization. (a and b) The images were acquired from a TEM at 120 kV and show an average Qdots size of 9.15 ± 0.87 nm. (c) DLS analyses of conjugated nanocrystals estimated the size of the nanocomplex to 26.1 ± 0.4 nm with a polydispersity index of 0.162 ± 0.047 and a ζ-potential of -12.7 mV. Murine (d) neuroblastoma (N2A) and (e) brain endothelioma (bEnd5) cells were seeded in 96-well plates containing DMEM (+10% FBS). Cells were pretreated for 15 min with unlabeled Ri7 or control IgG (0, 10, 50, or 200 nM), followed by the addition of 8.3 nM Ri7-Qdots. Values are expressed as the mean ± standard error of the mean (SEM) of two experiments in triplicate. Statistical comparison: (d and e) one-way ANOVA followed by a Bonferroni post hoc test, ***p < 0.001 and ****p < 0.0001 versus unlabeled IgG. Control values (without unlabeled mAbs) were adjusted to 100%. (f to h) N2A and (i to k) bEnd5 cells were pretreated with 50 nM unconjugated control IgG (f and i), 8d3 (g and j), or Ri7 cells (h and k), and then incubated with 16.7 nM Ri7-Qdots. Qdots can be seen in red and nuclei in blue. Scale bars, b = 20 nm, f and i = 20 µm, g, h, j, and k = 40 µm.

