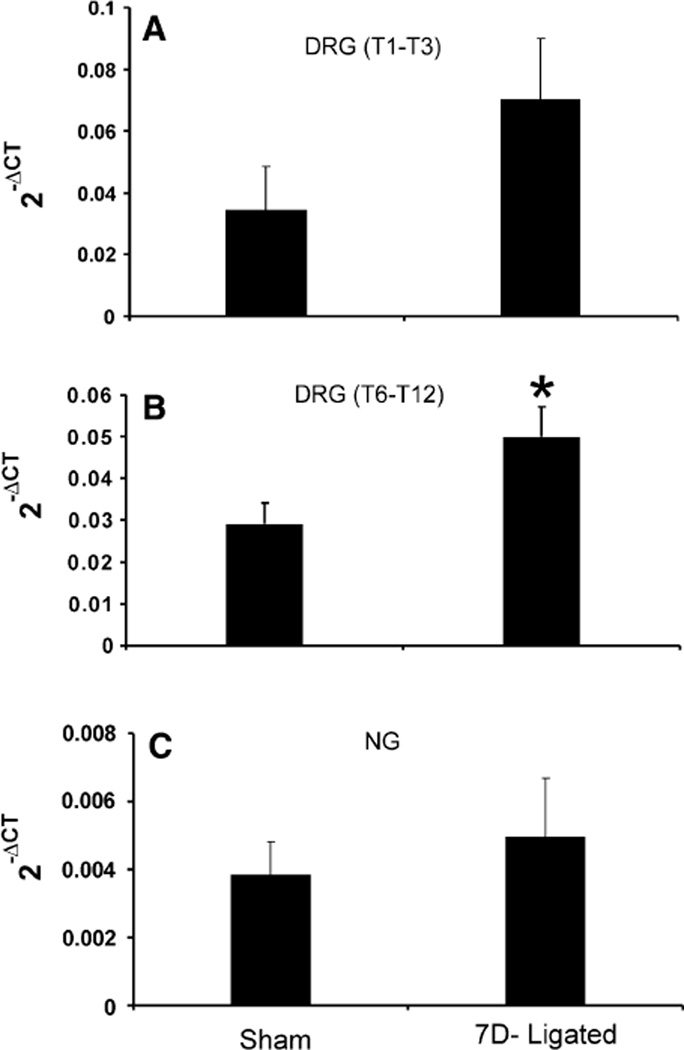
Fig. 2.
Real time RT–PCR for P2X3 gene expression in the thoracic DRGs and NGs from 7D-ligated and sham-operated rats. a In DRGs, cDNAs from respective groups were amplified using primers for P2X3. b In NGs, cDNAs from respective groups were amplified using primers for P2X3. ΔCT indicates the difference between the number of cycles necessary to detect the PCR products of the experimental gene and the reference gene. Ordinate values correspond to the receptor mRNA expression relative to the reference gene in the tissue. Values are the mean ± SD of three real time PCR determinations

