Fig. 8.
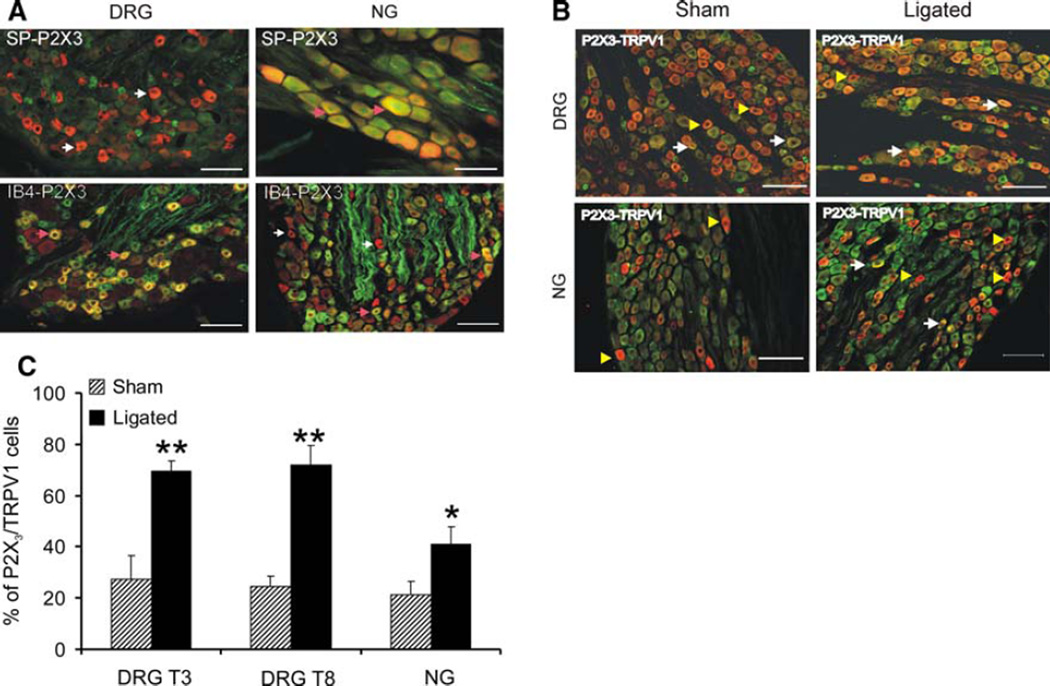
a Distribution pattern of P2X3 immunoreactivity in peptidergic and non peptidergic small diameter c-fibers in DRG (T3) and NG. DRG sections from sham-operated rat with P2X3-SP immunostaining (left column, upper panel) and P2X3-IB4 staining (left column, lower panel). NG sections from sham-operated rat with P2x3-SP staining (right column, upper panel) and P2X3-IB4 staining (right column, lower panel). In the DRGs 85% of P2X3 immunopositive cells was IB4-positive in comparison to 50% in the NGs. For P2X3-SP immunostaining 4% in DRGs and 20% NGs showed coexpression. Arrows (pink) indicate P2X3 positive cells with IB4 or SP immunostaining and arrows (white) indicate P2X3-positive cells without IB4 or SP binding. The scale bar is 100 µm. b Coexpression of P2X3-positive cells with TRPV1 in DRGs and NGs. A representative double immunostaining in the DRGs (T8) is as follows: sham-operated (left column, upper panel) and 7D-ligated rats (right column, upper panel). For NGs, sham-operated (left column, lower panel) and for 7D-ligated (right column, lower panel). Both in DRGs and NGs coexpression of TRPV1 in P2X3-positive cells were significantly higher in 7D-ligated animals compared to sham-operated controls (*P < 0.05). Arrows indicate P2X3-positive cells coexpressing TRPV1 and arrow heads indicate P2X3-positive cells without TRPV1 immunostaining. The scale bar is 100 µm. c Analytical data of P2X3 and TRPV1 co expression in thoracic DRGs and NGs from 7D-ligated and sham-operate rats. The percentage of P2X3-and TRPV1 double labeling is significantly high in thoracic DRGs T3 and T8 and in NGs (**P < 0.01, *P < 0.05 vs. sham-operated controls)

