Figure 6.
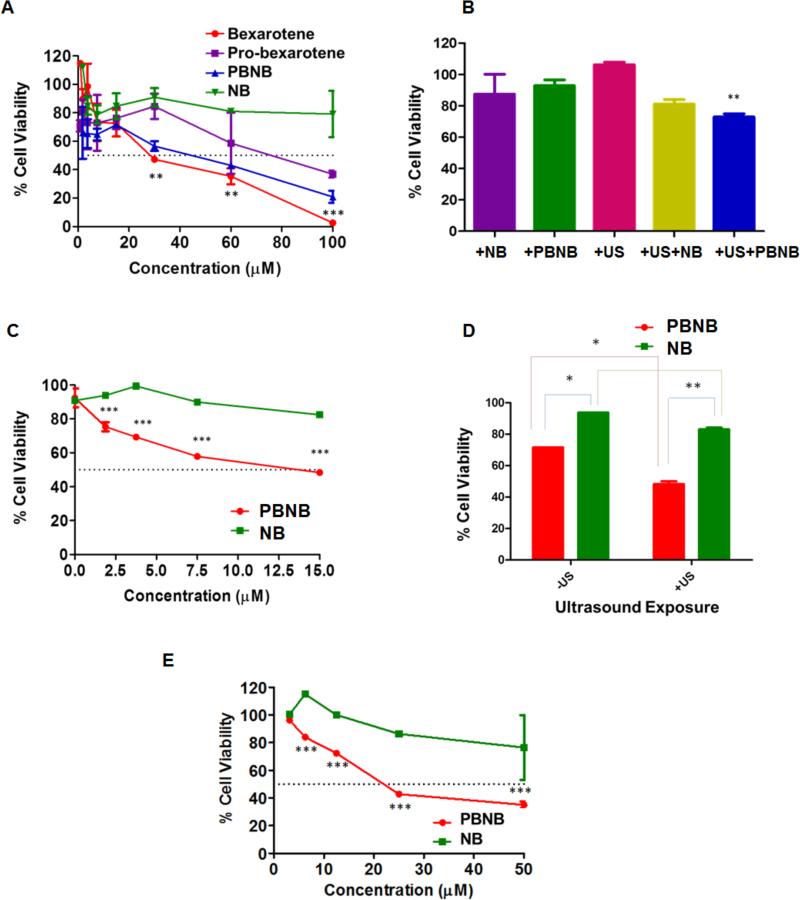
In vitro MTT assay experiments for establishing HCC growth regression in HepG2 cells after 72h of incubation. (A) MTT assay on HepG2 cells treated with formulations to establish effective concentrations after 72h of treatment; (B) Optimization of US parameters for establishing effective improvements in US mediated enhancements in growth regression of HePG2 cells after 24h of treatments with 5 μM; (C) Effect of therapeutic nanobubble, PBNB on HCC growth regression after optimized US exposure at 72h time point at concentration of 15, 7.5, 3.75, 1.87 and 0.93 μM. A two way ANOVA was performed to be found as biologically significant difference in cell growth inhibition efficiency between PBNB and NB at all used concentrations. (D) Bio-statistical significance of therapeutic nanobubble (PBNB) treatment and US exposure at concentration of 10 μM for 72h in HepG2 cells and (E) Effect of therapeutic nanobubble, PBNB on HCC growth regression after optimized US exposure at 120h time point at concentration of 50, 25, 12.5, 6.25 and 3.125 μM.

