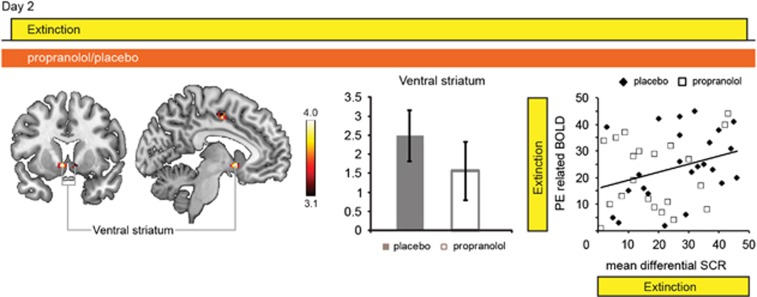
Figure 4.
Prediction error analyses results. Left: Analyses of prediction error-related neural signals revealed an area in the ventral striatum (small-volume correction (SVC) nucleus accumbens based on Adcock et al, 2006; Carter et al, 2009). MNI (Montreal Neurological Institute): −6, 8, 6. Z-value=4.93. Cluster size is the number of significant voxels at p<0.001; uncorrected: 58. Middle: Ventral–striatal prediction error-related activity was not modulated by beta-blockade (independent-samples T-test t(43)=1.022, P=0.313; placebo mean: 2.585, SEM, 0.672, propranolol mean: 1.432, SEM, 0.790). Right: Ventral striatal prediction error-related activity was associated with greater differential skin conductance response (SCR) during extinction (rs=0.396, P=0.007), but critically showed no correlation with spontaneous recovery (rs=0.039, P=0.801) or reinstatement of fear (rs=0.136, P=0.379). Bar indicates T-values of main effects. Activation clusters are displayed overlaid on selective slices of a template brain, and thresholded at p<0.001. Display view follows neurological convention, that is, right hemisphere is depicted on the right. Placebo group (solid bars), propranolol group (open bars), and error bars reflect SEM.

