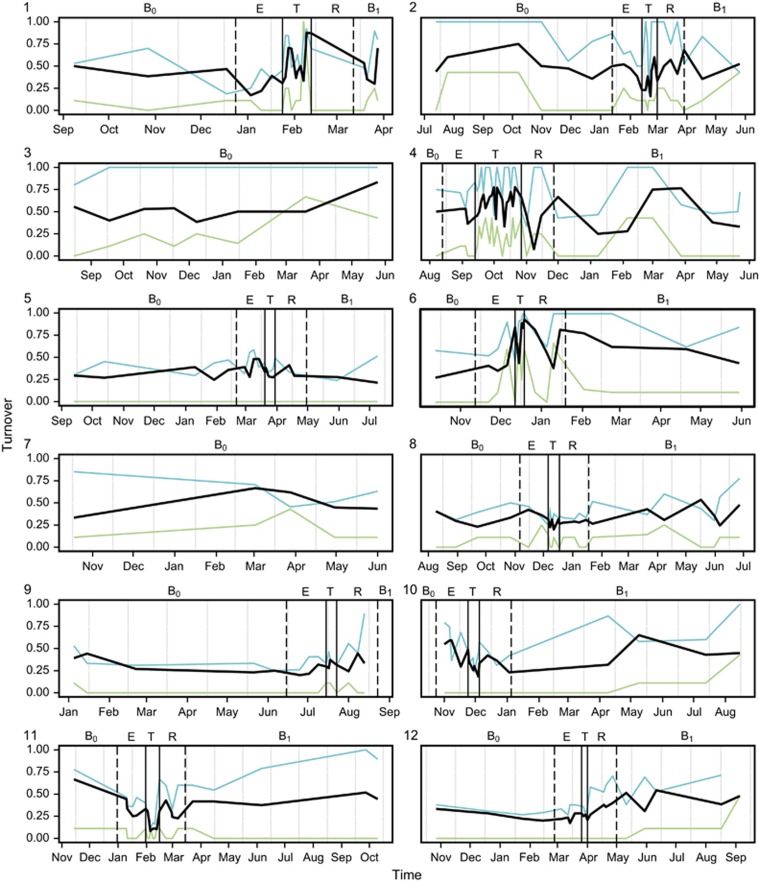
Figure 2.
Changes in the rate of OTU turnover for each patient over time. Solid vertical lines indicate the start and end of treatment for CFPE, and dashed lines indicate the start and end of the 30-day period either side of the treatment period. Disease states are denoted by (B0) baseline pre-CFPE; (E) CFPE, 30 days prior to treatment; (T) treatment for clinical exacerbation; (R) recovery, 30 days post-CFPE treatment; and (B1) stable post-CFPE. Black lines represent turnover in the whole microbiota, while green and blue lines represent turnover within the core and rare OTUs groups, respectively.

