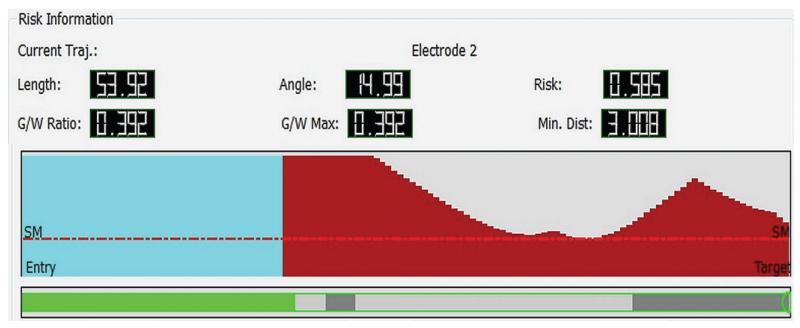
Fig. 2.
Graphic visualization of metrics associated with individual trajectories. upper: Length, angle traversing skull, risk, gray/white (G/W) ratio, and minimum distance from a blood vessel > 1 mm in diameter. center: Graphic display of closest critical structure along length of trajectory (red = artery, cyan = vein, y-axis = distance to structure [maximum 10 mm], x-axis = distance along trajectory from brain entry to target, SM = safety margin represented as horizontal red line that marks 3-mm separation of trajectory to critical structure). lower: Graphic display of trajectory path through gray and white matter (green = extracerebral, gray = gray matter, white = white matter).

