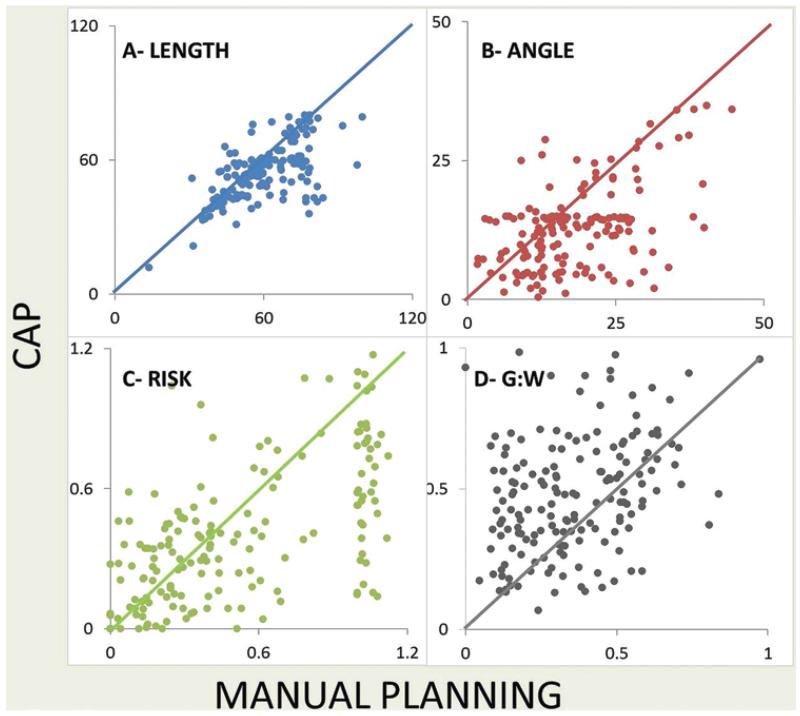
Fig. 4.
Comparison of manual planning versus CAP for electrode length (A), angle of entry (B), risk (C), and gray-white matter ratio (G:W; D). In each graph, the x-axis represents manual planning and the y-axis represents computer-assisted planning. Each point represents the value of the given metric for manual planning and CAP. Any point located below the diagonal line means that the value derived from manual planning is greater than that from CAP and vice versa. For A, B, and C, values below the line indicate superiority of CAP over manual planning. For D, values above the line indicate superiority of CAP over manual planning.

