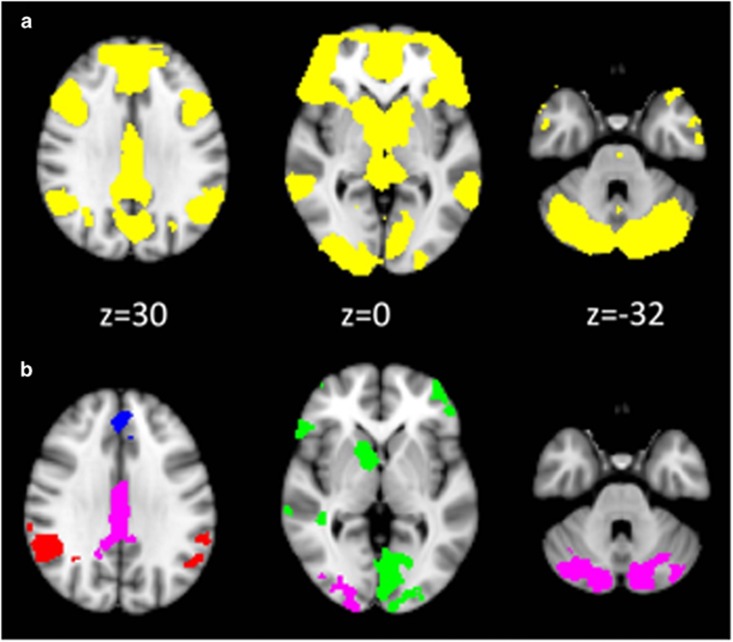
Figure 2.
fMRI results: receipt of unexpected reward. Left hemisphere is shown in the right side of the image. Coordinates are expressed in mm, and in standard space. Panel a: entire sample pooled analysis. The yellow color indicates significant voxels thresholded at p<0.05 family-wise error (FWE) voxelwise corrected for illustrative purposes. Panel b: between groups analysis using ANOVA. Colored clusters indicate those clusters indicating significant group differences (cluster threshold Z>2.0 p<0.05 FWE whole-brain cluster corrected) and the particular color indicates the results of post hoc tests. Green areas are clusters where the control group has greater activation compared with the depression group and compared with the schizophrenia group; blue areas are clusters where controls have greater activation compared with the depression group and compared with the schizophrenia group, and the depression group has greater activation than the schizophrenia group; red areas are clusters where controls have more activation than the schizophrenia group and the depression group has more activation than the schizophrenia group; lilac areas are clusters those where the control group has more activation than the schizophrenia group.

