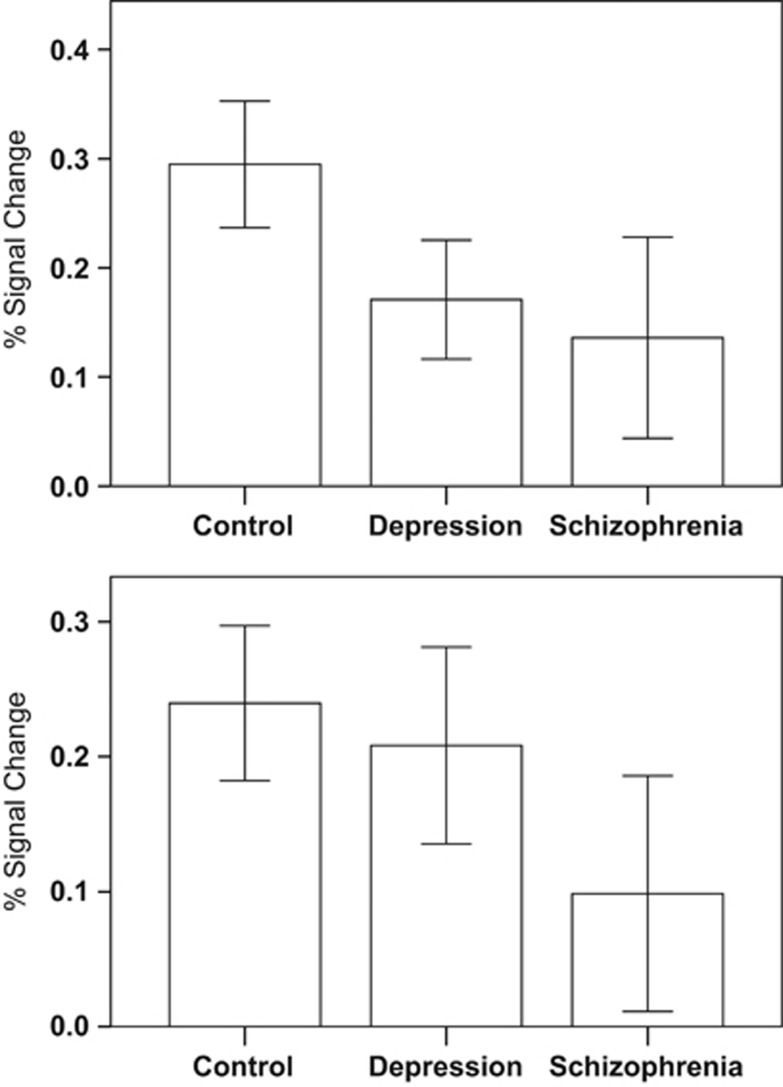
Figure 4.
The upper panel shows the mean percent signal change for unexpected reward receipt for the left ventral striatal/orbitofrontal cluster where both patient groups had suppressed activation relative to controls. In contrast, the lower panel shows the mean percent signal change for unexpected reward receipt in the left lateral parietal lobe (angular gyrus and supramarginal gyrus) where activation was suppressed in schizophrenia compared with controls but relatively intact in depression. Error bars are 95% confidence intervals. For graphs of results of other clusters please see Supplementary Material.

