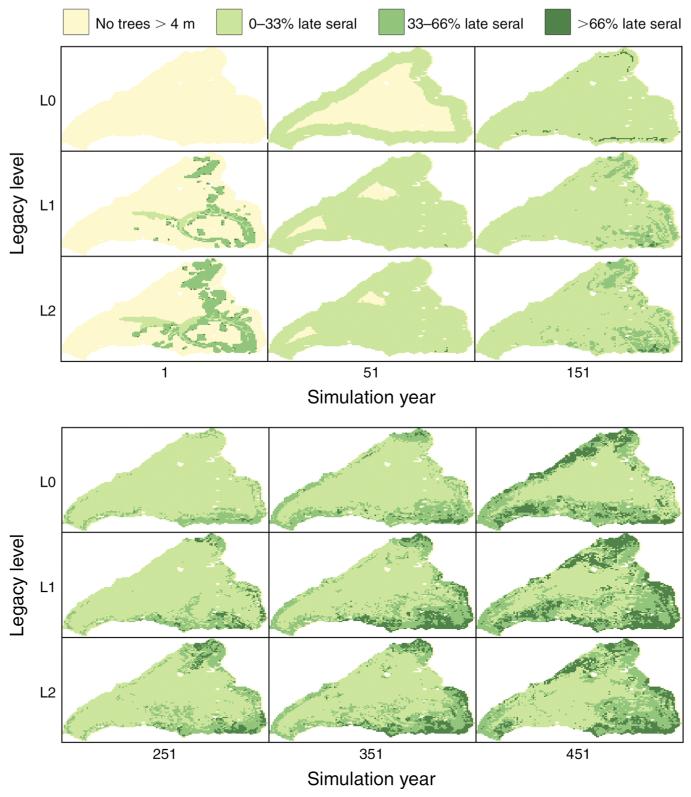
Fig. 2.
Maps of the 6364-ha H. J. Andrews Experimental Forest landscape (grain: 100-m grid), showing seral stages for six points in time and three initial legacy levels (L0, no legacies; L1, remnant trees on 12% of the landscape; L2, remnant trees on 24% of the landscape). The values are cell-level means over 25 replicated simulations per series and assume the historically observed mean fire return interval of 262 years (scenario F1). Note that late-seral species proportions are calculated for stocked areas only (trees >4 m in height), and that the persistence of initial survivors beyond the starting year is masked by regenerating early-seral species in areas adjacent to remnant old-growth patches in the spatial aggregation to 100 × 100 m pixels. With regard to the persistence of remnant old-growth patches, see Appendix C: Fig. C1.

