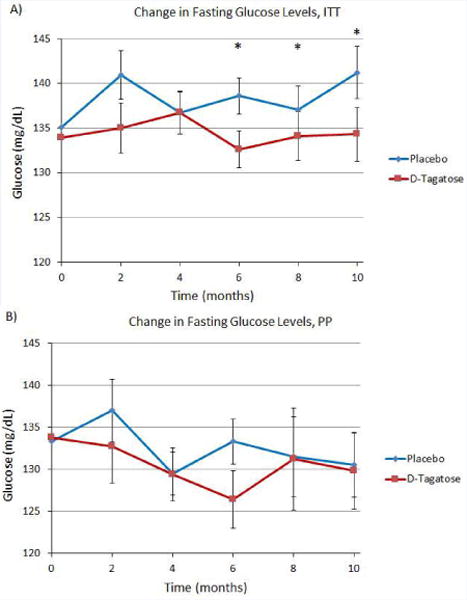
Figure 4.

(A) Change in fasting blood glucose, ITT population. D-tagatose significantly decreased fasting blood glucose compared to placebo after 6 months of treatment. (B) Change in fasting blood glucose levels, PP population. No significant difference between placebo and D-tagatose groups was observed at any time point. Zero time points plotted as means, remaining time points plotted as least squares means ±SEM.
