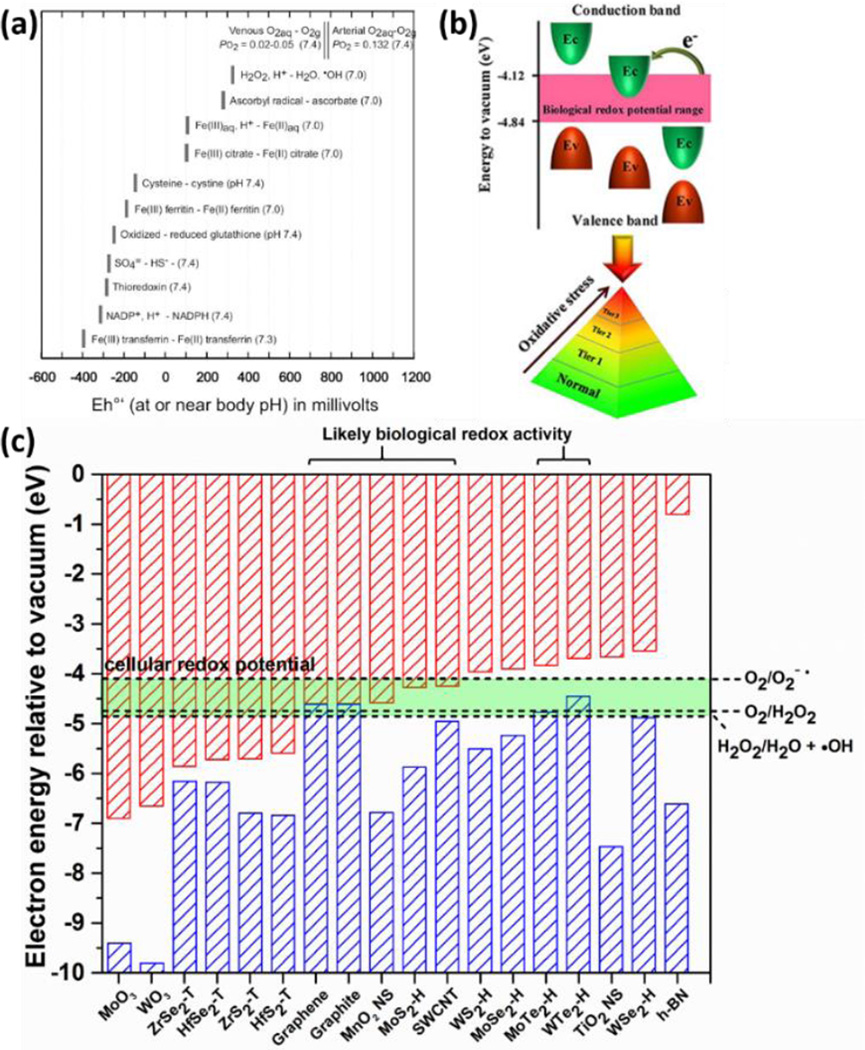
Figure 10.
Band structures of 2D and bulk layered materials, and band alignment with the cellular redox potential and the ROS-involved redox couples. (a) Cellular redox potential range defined by biomolecular redox couples. Reprinted with permission from ref. 323. Copyright 2006 Mineralogical Society of America. (b) The illustration of platform for modeling of structure–activity relationships based on band structures. Reprinted with permission from ref. 192 Copyright 2012 American Chemical Society. (c) The comparison a physicochemical in silico screening tool for identifying specific 2D materials with high potential for biological redox activity. Construction of the framework is based on published data in graphite,331 single wall carbon nanotubes,332 TMD,333 h-BN,334 MnO2 nanosheets,335 lepidocrocite-type TiO2 nanosheets,336 MoO3 and WO3,337 and ROS-involved redox couples.338

