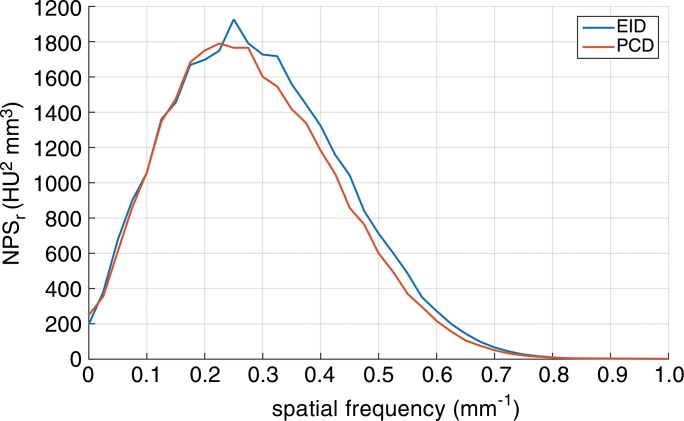
Figure 2b:
Quantitative assessment of the EID and PCD systems with an American College of Radiology (ACR) CT phantom. (a) Graph shows the radial modulation transfer function (MTF) at 10 cm off the isocenter. (b) Graph shows the noise-power spectrum (NPS). (c) Bar graphs show CT number (Hounsfield unit) accuracy in five different calibrated regions of the American College of Radiology CT phantom: bone, polyethylene (PE), acrylic, air, and water.

