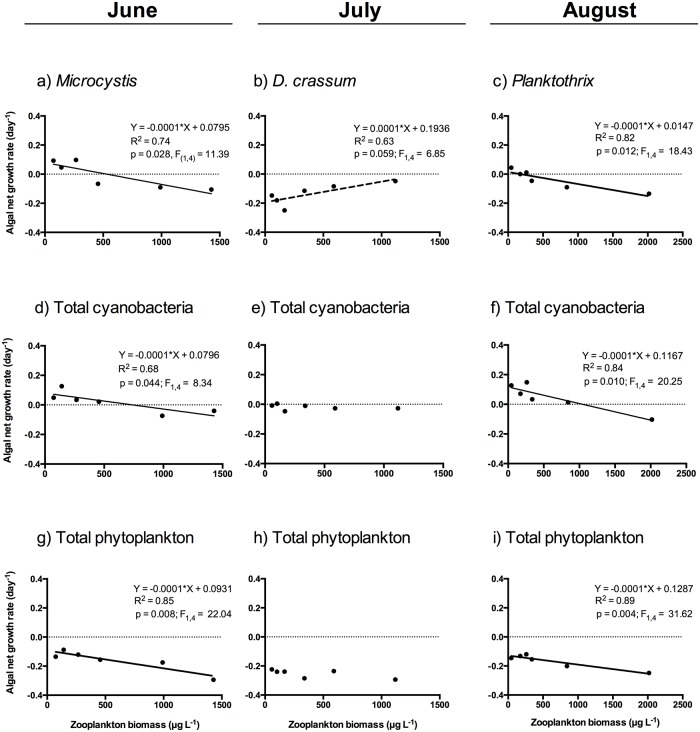
Fig 2. Example responses of selected cyanobacterial taxa (a-c), total cyanobacteria (d-f) and total phytoplankton (g-i) to the increasing gradient of Daphnia biomass during the grazing experiments conducted in June, July and August in the eutrophic lake Ringsjön.
Fitted regression lines (n = 6), model equations, F-values, R2 values and P-values are given for significant linear relationships (P < 0.05, solid line). Note that for Dolichospermum crassum (July experiment) there was a marginally significant positive linear relationship (P = 0.059, broken line).

