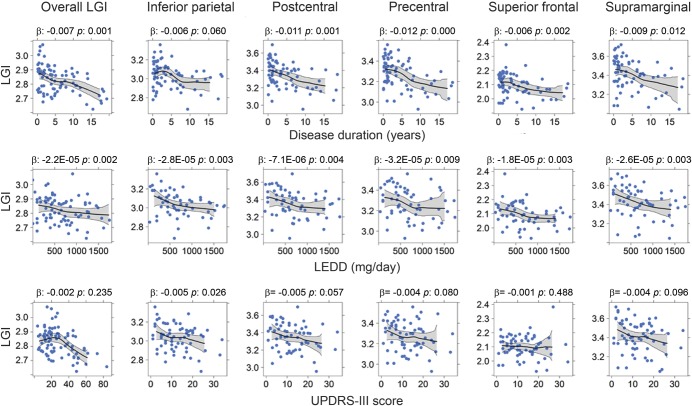
Figure 2. Relationships of baseline regional local gyrification index and clinical measurements among Parkinson disease (PD) participants in the longitudinal cohort.
Descriptive plots illustrate the relationship between regional local gyrification and clinical measurements among PD participants in the longitudinal cohort. Center lines (black) and gray areas represent the moving average and 95% bootstrapped confidence region for local gyrification index as a function of clinical measurements. The β and p values were obtained via multiple linear regression for each clinical variable. Two data points were not shown in the levodopa-equivalent daily dose (LEDD) plots because they had LEDD >1,800 mg/d. LGI = local gyrification index; UPDRS = Unified Parkinson's Disease Rating Scale.

