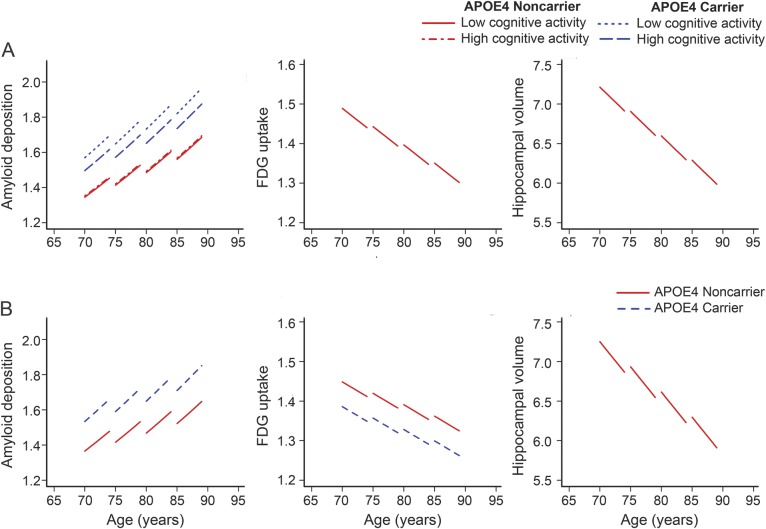
Figure 2. Plots for biomarker outcome models run after education stratification.
Longitudinal trajectories for predicted (left panel) amyloid deposition, (middle panel) 18fluorodeoxyglucose (FDG) uptake, and (right panel) hippocampal volume as a function of age. In the top panels (A), participants were in the higher education cohort (education ≥14), and the lower panels (B) participants were in the lower education cohort (education <14). In each of the plots, the variables that significantly influenced the trajectories are additionally plotted. High cognitive activity was defined as the 67th percentile, and low cognitive activity as the 33rd percentile.

