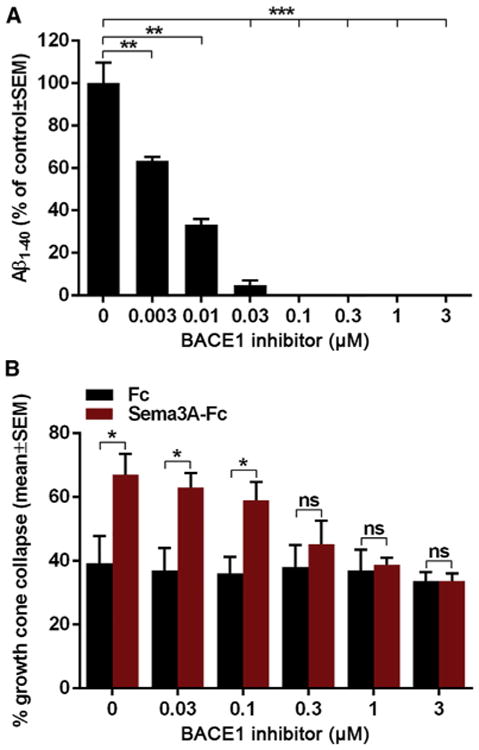
Figure 5. BACE1 Inhibitor Dose Curve Response in Thalamic Neurons.

(A) Aβ1–40 levels in the conditioned medium of WT thalamic neurons after treatment with BACE1 inhibitor (0, 0.003, 0.01, 0.03, 0.1, 0.3, 1, and 3 μM CIV).
(B) Quantification of Sema3A-induced growth cone collapse in WT thalamic neurons after treatment with BACE1 inhibitor (0, 0.03, 0.1, 0.3, 1, and 3 μM CIV).
Results are presented as mean ± SEM.
