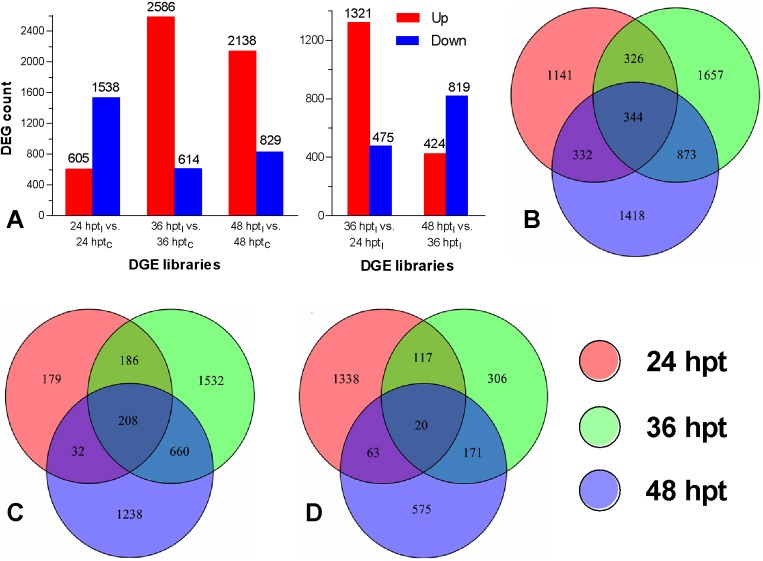
Fig 3. Identification of P. xylostella DEGs at 24, 36 and 48 h post treatment of infection (hptI) and control (hptC).
(A) Counts of DEGs in the DGE libraries of 24 hptI/24 hptC, 36 hptI/36 hptC and 48 hptI/48 hptC (left) or of 36/24 hptI and 48/36 hptI (right). (B–D) Venn diagrams for the total counts of host genes differentially expressed and those upregulated and downregulated at 24, 36 and 48 hptI respectively. Note the counts of those co-upregulated (C) or co-downregulated (D) at the two time points of 36/24 and 48/36 hptI and at the three time points.

