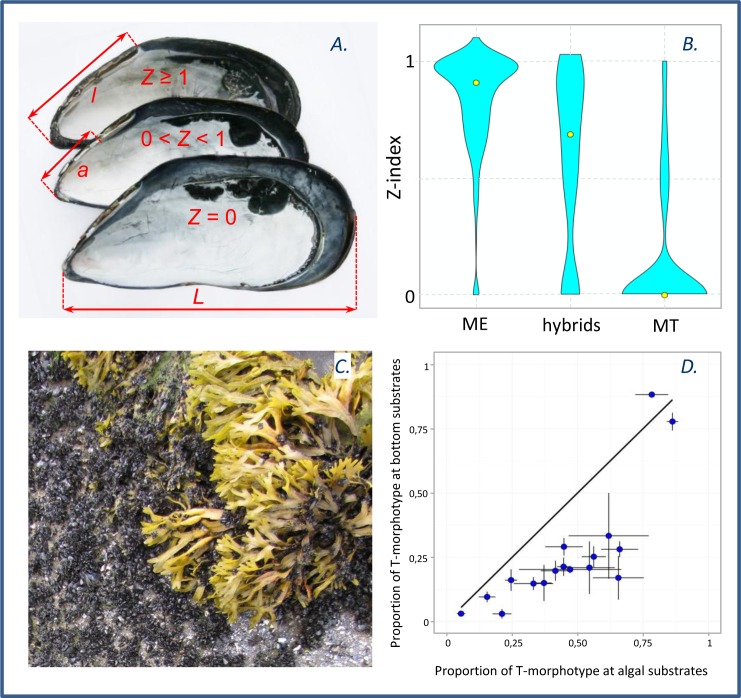
Fig 2. Mussel morphotypes and their distribution between different genotypes, and between algal and bottom substrates.
(A). Mussel shells of different morphotypes: T-morphotype with an unbroken prismatic dark strip under ligament (lower shell) and E-morphotypes with the dark strip broken (middle) or absent (upper shell). Measurements indicated: L–total shell length, l–distance from shell umbo to the posterior end of the ligament, a–distance from umbo to the anterior end of the dark strip. The index Z = a/l; values of Z corresponding to the different morphotypes are shown. (B). The kernel density function of Z-values within the three genotypic classes (all samples pooled, the genotypic classes defined on the basis of STRUCTURE analysis, see text for details). Yellow dots indicate the medians. (C). Mussels growing on different substrates: on bottom ground vs. fucoid thalli. (D). The mean frequencies of T-morphotype (Z = 0) ± standard error on the algae (horizontal axis) plotted against that on the bottom in samples from 17 sites of MDS. If frequencies were identical on both substrates, the dots would fall on the diagonal (black line).

