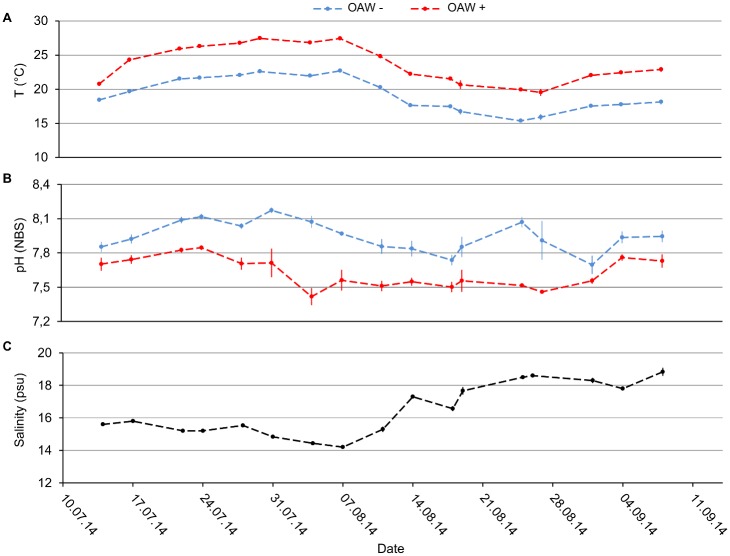
Fig 1. Temperature, pH and salinity during the OAW x nutrient experiment.
(A) Temperature (°C), (B) pH (NBS, National Bureau of Standards) under the two treatment combinations ambient (OAW-), warmed and acidified (OAW+) and (C) salinity (psu) at the ambient treatment (OAW-). Data are the mean ±SD of three replicates in each treatment combination.

