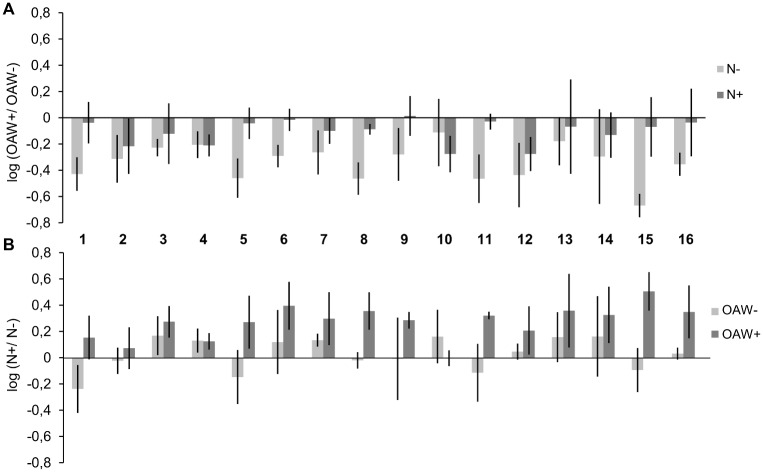
Fig 3. Log effect ratios of growth in 16 sibling groups during the OAW x nutrient experiment.
Log effect ratios (mean ± 95% confidence intervals, n = 3) of (A) OAW effects were calculated as log (growth OAW+/ growth OAW-) under ambient and high nutrient conditions (N-, N+) and (B) log effect ratios for nutrient effects calculated as log (growth N+/ growth N-) at ambient and high OAW (OAW-, OAW+).

