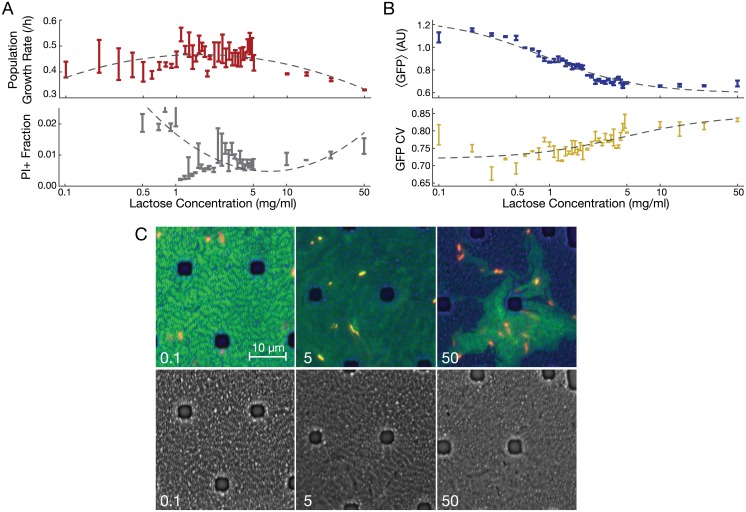
Fig 3. Population and individual cell fitness of E. coli (lacI− B REL606) in varying growth conditions.
(A) Mean ± SEM (N = 3) growth rate (p < 10−6 for no trend in lactose concentrations > 1 mg/ml) and fraction of propidium iodide-stained (PI+) cells (p = 0.0051 for no PI+ trend in lactose concentrations > 1 mg/ml) at various lactose concentrations. Dashed lines indicate quadratic regression models, which fit significantly better than do linear models (see text for details). PI+ fractions at low lactose concentrations are shown in S4c Fig. (B) Mean ± SEM (N = 3) expression of GFP at various lactose concentrations (p = 0.00016 for no trend). CV, coefficient of variation (p < 10−6 for no trend). Dashed lines indicate fits of statistical models used as a guide to the eye (fitted model is: ). (C) PI-stained E. coli grown in a microfluidic device perfused with the indicated concentration of lactose (mg/ml). Note the patchy distribution of fast growing (low GFP) and slow- or non-growing (high GFP) cells at 50 mg/ml lactose. Brightfield alone is shown below. PI staining identifies dead cells and appears red or yellow, depending on the amount of GFP in the same cell. Dark spots are silicone support structures.

