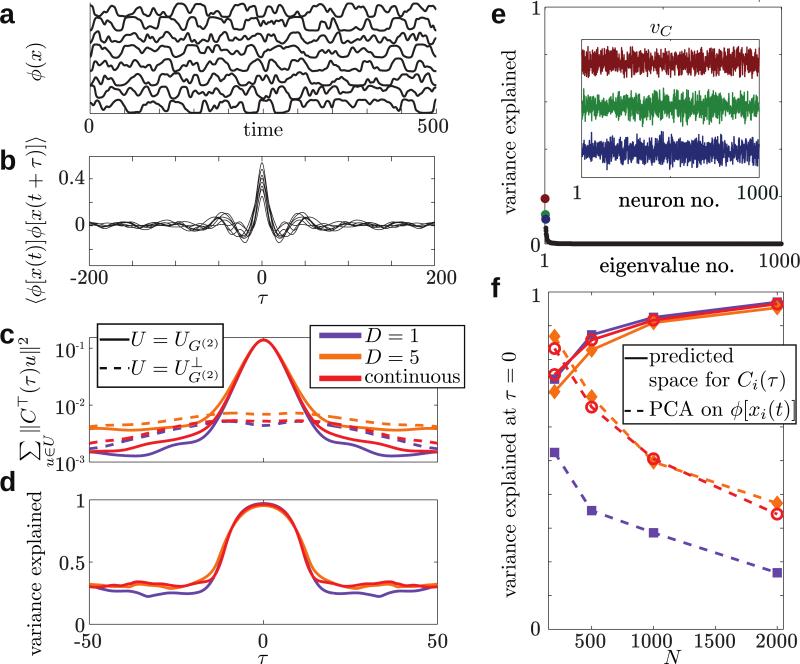
FIG. 2.
Low-dimensional structure of network dynamics. Traces of the firing rates ϕ[xi(t)] (a) and autocorrelations Ci(τ) (b) of eight example neurons chosen at random from the network with continuous gain modulation (shown in the bottom row of Fig. 1). (c) The sum of squared projections of the vector Ci(τ) on the vectors spanning UG(2) (the active modes, solid lines) or (the inactive modes, dashed lines). The dimension of the subspace UG(2) is K★ = 1 for the network with g = const and K★ = 3 for the block and continuous cases (orange and red, respectively), much smaller than N – K★ ≈ N, orthogonal the dimension of the complement space . (d) Our analytically derived subspace accounts for almost 100 percent of the variance in the autocorrelation vector for (in units of the synaptic time constant). (e) Reducing the dimensionality of the dynamics via principal component analysis on ϕ(x) leads to vectors (inset) that account for a much smaller portion of the variance (when using same dimension K★ for the subspace), and lack structure that could be related to the connectivity. (f) Summary data from 50 simulated networks per parameter set (N, structure type) at τ = 0. As N grows the leak into diminishes if one reduces the space of the Ci(τ) data while the fraction of variance explained becomes smaller when using PCA on the ϕ[xi(t)] data, a signature of the extensiveness of the dimension of the chaotic attractor.

