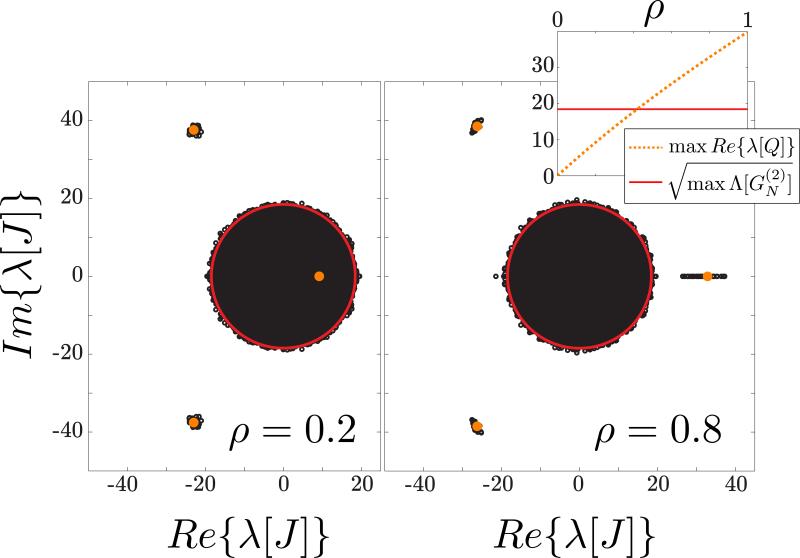
FIG. 4.
Spectrum of connectivity matrices with heterogeneous, correlated joint degree distribution. The network parameters were chosen to be κ = 0.7, θ = 28.57, NE = 1000, NI = 250, p0 = 0.05, W0 = 5, where κ and θ are the form and scale parameters respectively of the distribution from which the in- and out-degree sequences are randomly drawn. The average correlation ρ between the in- and out-degree sequences was varied between 0 and 1. For the values ρ = 0.2 (left) and ρ = 0.8 (right) we drew 25 degree sequences and based on them drew the connectivity matrix according to the prescription outlined in Sec. V. The eigenvalues of each matrix were computed numerically and are shown in black. For each value of ρ we computed the average functions , etc., and the roots of the characteristic polynomials and (see Appendixes B and C for derivation). The predictions for the support of the bulk (solid red line) and the outliers (orange points and dotted line) are in agreement with the numerical calculation. Inset: as a function of ρ, there is a positive outlier that exits the disk to the right.

