
Figure 1.
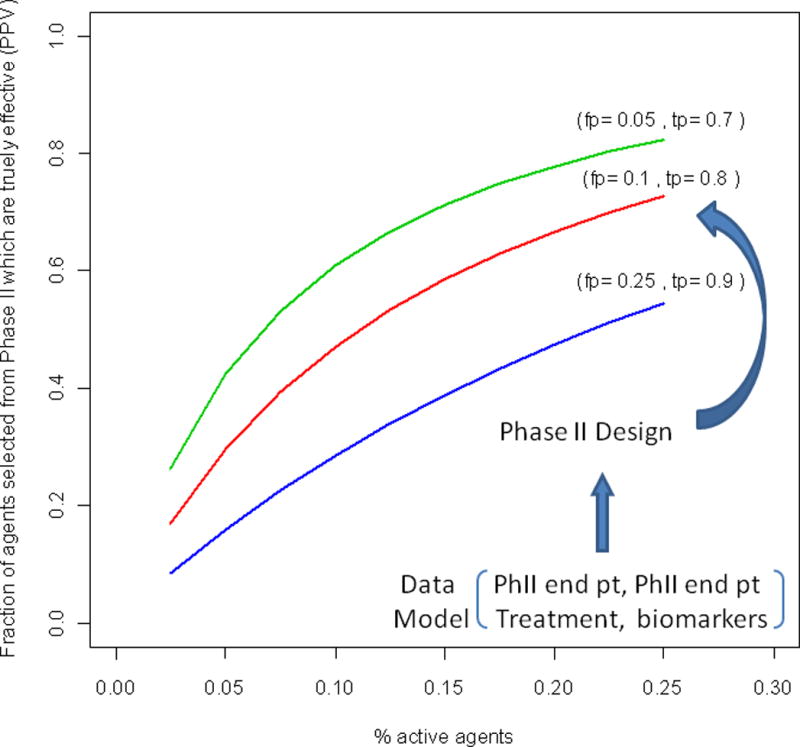
The fraction of agents selected for Phase III study which are effective as a function of the % of active agents undergoing Phase II testing, the false positive rate (fp) and the true positive rate (tp) of the design.
The properties fp and tp depend on the chosen Phase II design and how the Phase II endpoint and Phase III endpoint models jointly depend on the treatment assignment for the specific disease.