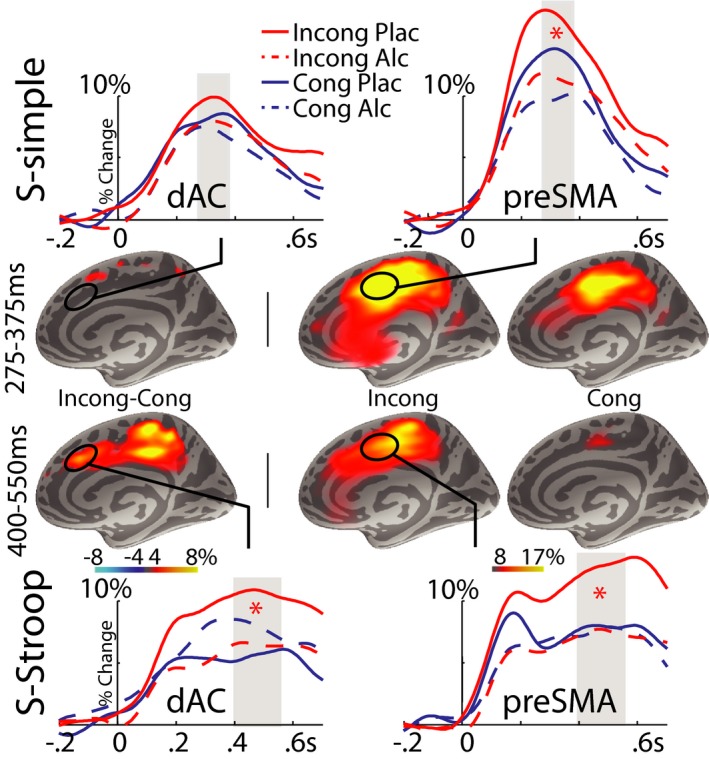
Figure 4.

Group average maps and time courses of event‐related theta source power estimated to the right medial cortical surface. The left‐most panel shows the maps of the differential activity between incongruous (Incong) and congruous (Cong) conditions whereas the middle and right‐hand maps show the overall event‐related theta power to the Incong and Cong conditions. The maps show activity integrated across the time windows uses in statistical analysis, as indicated by gray bars overlaid on the time courses. Red stars indicate significant theta attenuation by alcohol only on the Incong trials (p < 0.05). Theta band power in the presupplementary motor area (pre‐SMA) and dorsal anterior cingulate (dAC) cortices peak in S‐simple and S‐Stroop from 257 to 375 and 400 to 550 ms, respectively. As the spatiotemporal patterns of activity were similar bilaterally, only the slightly dominant right hemisphere is shown. Data are presented as percent change relative to baseline.
