
Fig. 2. Characteristic time scale τ.
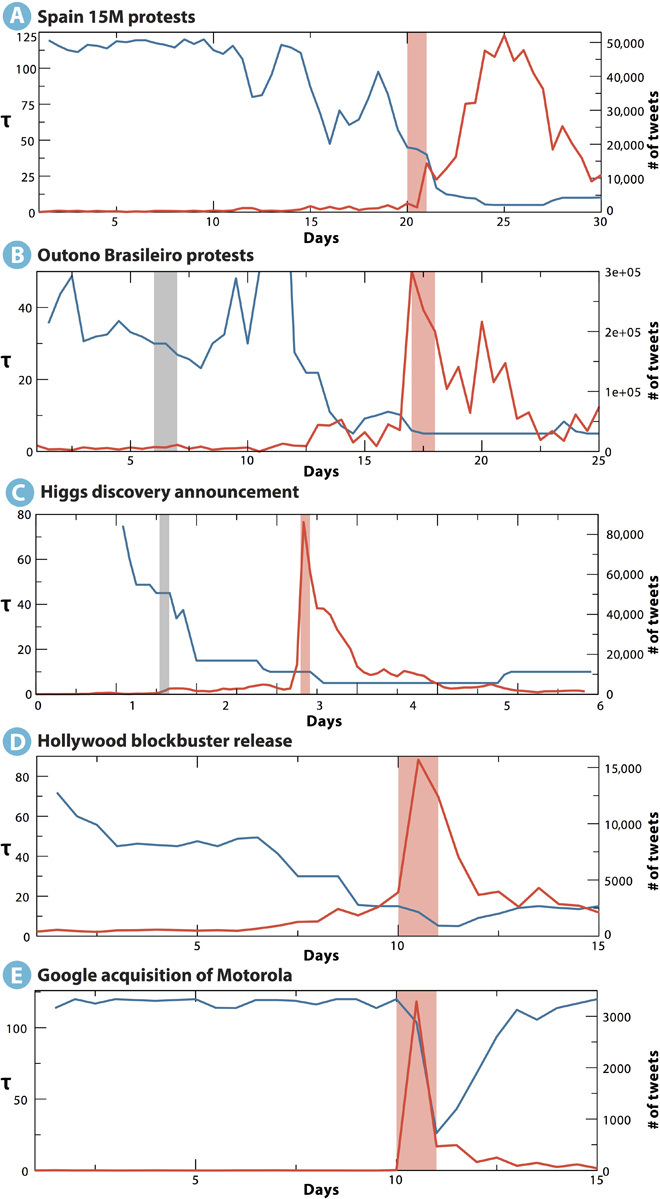
(A to E) The panels report the variation of the characteristic time scale (blue) that maximizes the STE flow as the social event is approached. Red lines correspond to activity volume (number of tweets). Light red vertical lines correspond to the onset of the main social event. Gray vertical lines (B and C) indicate a smaller precursor event. (A) The 15M event shows a progressive decline of the characteristic time scale well before the actual social event; the same is observed for the Outono Brasileiro in (B) (note a data blackout between days 10 and 11). The patterns for the Higgs boson discovery data set in (C) and the Hollywood blockbuster data (D) also reveal a drop in the characteristic time scale, although this is smoother in the movie case. Overall, in (A) to (D) (endogenous activity), the time scale has already dropped to 50% by the time the absolute volume signals a system-wide event. Finally, the Google-Motorola deal triggers a high volume of microblogging activity without actual change in the time scale of the information flow (E). In this case, the decline is observed in the aftermath of the announcement. As discussed in the main text, this event is the only one that is clearly elicited by an exogenous trigger.