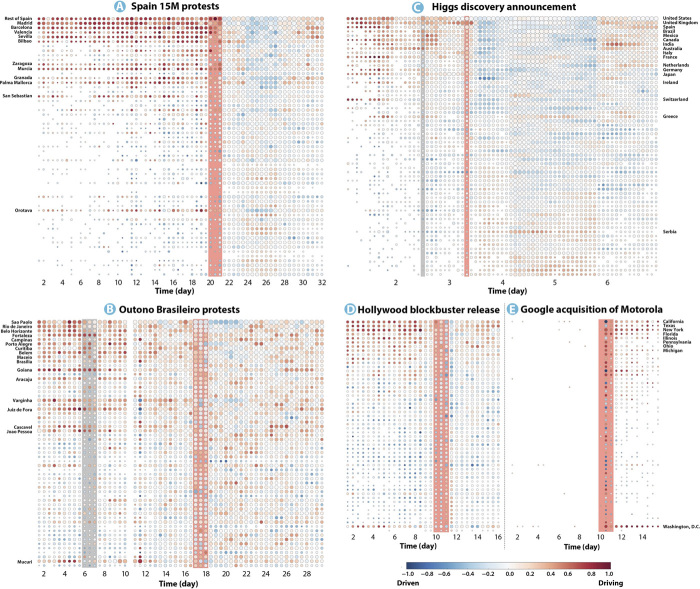
Fig. 3. Evolution of information flow balance between geographical locations for the analyzed events.
(A to E) The color goes from dark blue to dark red (white corresponds to null driving), with the former standing for negative values of (that is, driven locations) and the latter corresponding to positive information flow balances (that is, drivers). The size of the circles is log-proportional to the number of messages sent from the location at that time, and the vertical bars mark the day of the main event. The geographical locations are ordered according to population size, except for (C), in which countries are ranked with the amount of Higgs-related tweets produced.

