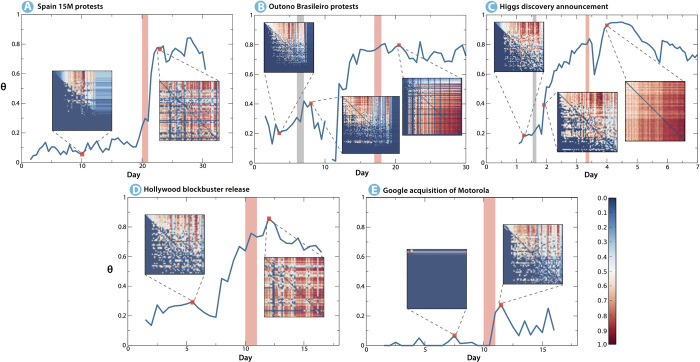
Fig. 5. Order parameter θ as a function of time for the five events analyzed.
The figure represents the behavior of the ratio characterizing the order/disorder of the effective connectivity matrix as a function of time (note a point missing in the Brazilian data set because of a data blackout between days 10 and 11). For each data set, two or three matrices T† are plotted, considering one or two times before and one after the main event (signaled with a red vertical bar). A clear transition from a hierarchical directed to a distributed symmetrical scenario is observed for events (A), (B), (C), and (D). The Google data set, depicted in (E), behaves differently by not showing the same evidence of transition effects.

