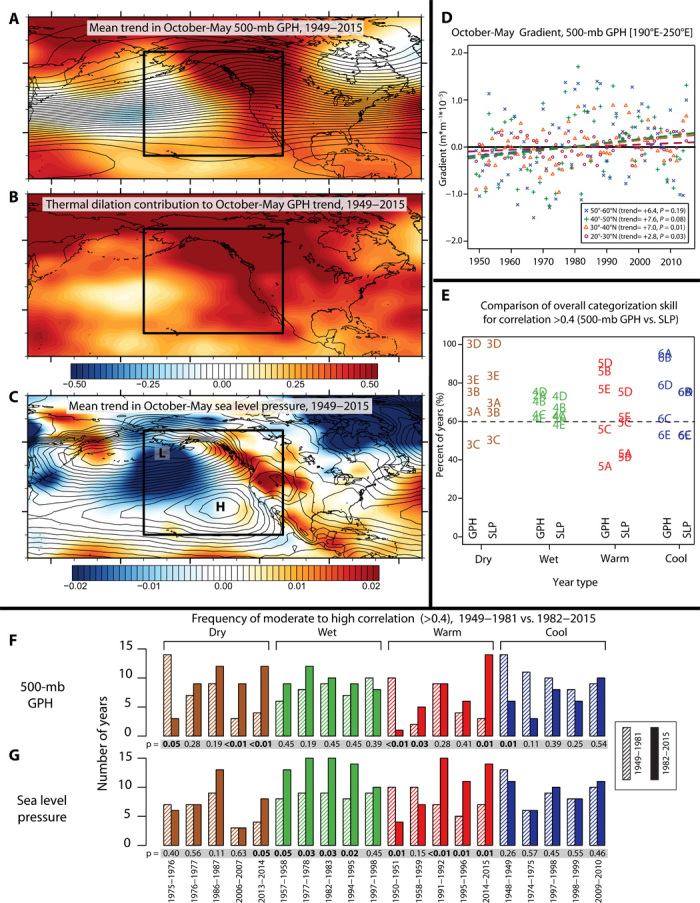
Fig. 1. Observed October-May changes across the northeastern Pacific.

(A) Mean trend in October-May 500-mb GPH over the northeastern Pacific and western North America, 1949–2015 (meters per year). (B) Contribution of lower tropospheric warming (thermal dilation) to observed October-May GPH trend (meters per year). (C) Mean trend in October-May SLP over the northeastern Pacific and western North America, 1949–2015 (millibars per year). Black box in (A) to (C) depicts the NPD. (D) Time series of mean October-May zonal gradient of 500-mb GPH in the NPD over four separate latitude bands (10−5 m/m). Units of reported trends are 10−8 m/(m*y). (E) Predictive skill of moderate to high pattern correlation using GPH and SLP. The quantity plotted is the percent of years that exhibited a pattern correlation of >0.4 with a particular extreme pattern and also experienced surface meteorological conditions of the correct sign (for example, low precipitation in a year that also had high correlation with one of the five dry patterns). Dashed horizontal line at 60% represents threshold for defining “increased likelihood” of a precipitation or temperature anomaly of the correct sign (as described in the text). Labels correspond to specific GPH/SLP patterns shown in matching figure panels in Figs. 3 to 6 [for example, “3D” corresponds to (D) in Fig. 3]. (F) Changes in the occurrence of GPH patterns that have moderate to high correlation (>0.4) with patterns of interest (that is, those associated with surface meteorological extremes). Left columns (striped fill) represent the 1949–1981 occurrence; right columns (solid fill) represent the 1982–2015 occurrence. Numbers in the gray horizontal rectangle under the column pairs indicate confidence (P values) that the change is statistically significant. (G) Same as in (H) but for SLP patterns.
