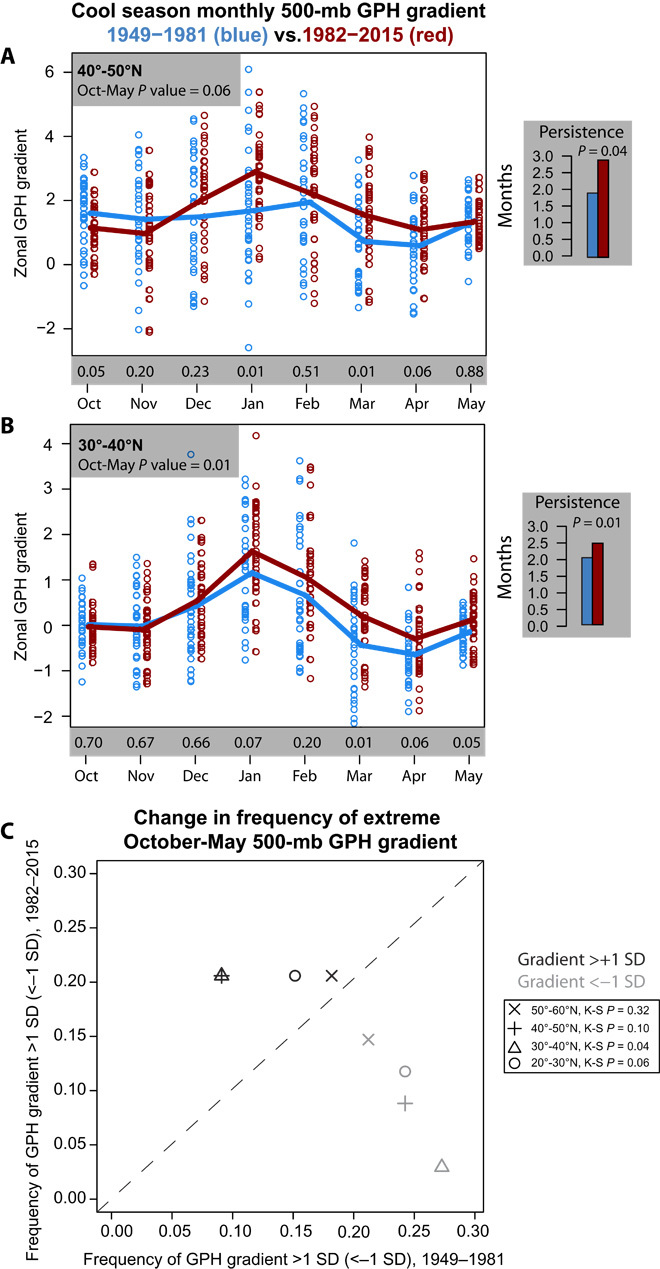
Fig. 2. Observed October-May changes in zonal GPH gradient over the northeastern Pacific.

Blue (red) points represent monthly values of the west-to-east GPH gradient averaged over the given range of latitudes from each year of the 1949–1981 (1982–2015) period. (A and B) Blue (red) curves represent monthly values of the west-to-east GPH gradient averaged over the given range of latitudes, averaged over 1949–1981 (1982–2015). The gray rectangles to the right of each panel show the change in subseasonal persistence of GPH gradients above the long-term average (months per year). Blue (red) columns represent mean values for 1949–1981 (1982–2015). (C) Change in extreme (±1 SD) 500-mb NPD GPH gradients between 1949–1981 and 1982–2015 over four separate latitude bands. Points above the dashed 1:1 line imply increasing frequency; points below 1:1 line imply decreasing frequency.
