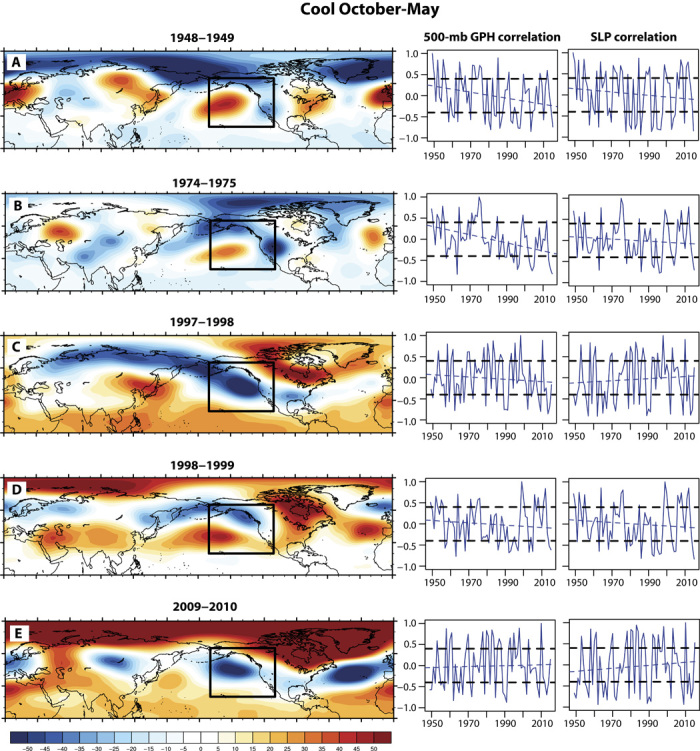
Fig. 6. Trends in California extreme cool patterns.

(A to E) October-May 500-mb GPH anomaly patterns during California’s five coolest detrended cool-season periods between 1949 and 2015 (left column) and time series of pattern correlation between GPH/SLP in each specific year of interest (right column) and all other years. Horizontal dashed black lines highlight ±0.4 correlation thresholds used to define moderate to high correlation in this study. Maps shown are October-May 500-mb GPH anomalies for the given year (meters).
