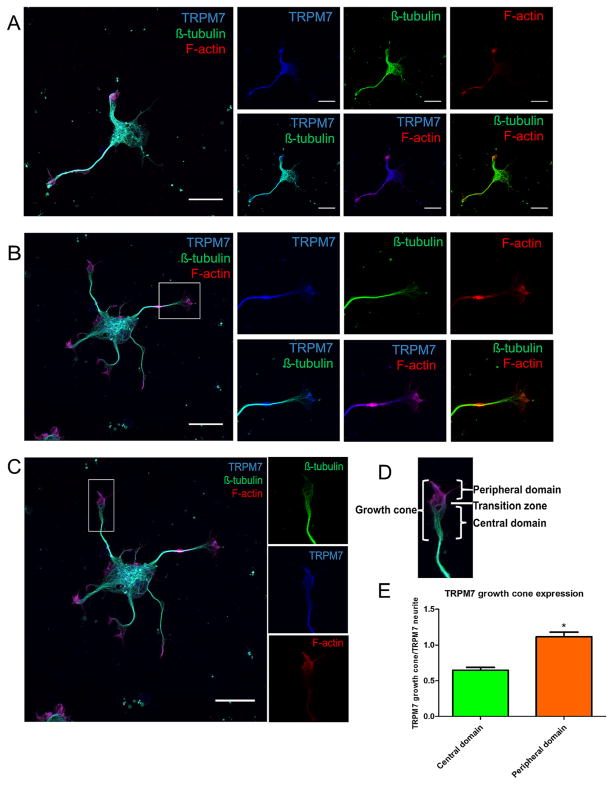
Fig. 1.
TRPM7 expression pattern in DIV2 hippocampal neurons. a DIV2 hippocampal neuron triple-stained with antibodies recognizing α-tubulin (green) and TRPM7 (blue) and rhodamine phalloidin for F-actin (red). two-image and three-image overlays were included to show the relative distribution of TRPM7 with respect to cytoskeletal structures. b, c Distribution of TRPM7 and cytoskeletal proteins in two separate growth cones. d Schematic of the domains within the growth cone. e Ratio of TRPM7 intensities in central and peripheral domains of the growth cone to TRPM7 intensity in the neurite; n=5 neurons, n=9 growth cones. Scale bars are 20 μm

