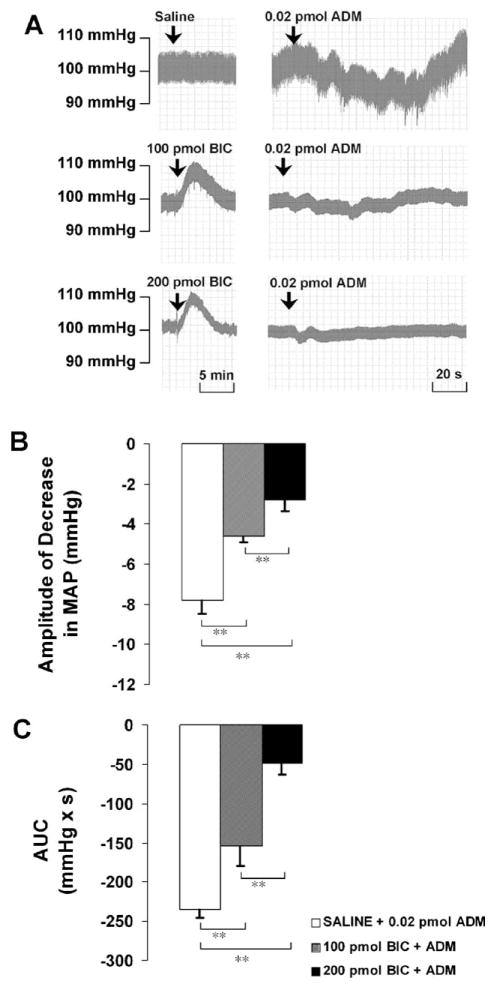
Fig. 6.
(A) Representative arterial pressure traces of rats that received ADM injections in the PVN after the pretreatment of saline or BIC at doses indicated. (B and C) Amplitude and AUC of decreases in mean arterial pressure (MAP) to microinjections of ADM into the PVN after the pretreatment of saline or BIC. Graphs represent mean ± S.E.M. N = 8 in each group. *P < 0.05, **P < 0.01.

