
Fig. 2.
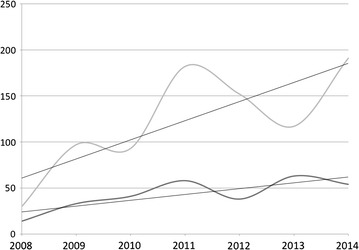
The rise in the use of limb saving surgery at KCH. The top curve shows the number of soft tissue procedures (debridements, flaps etc.) done for fractures per year, the bottom curve the number of external fixations for open fractures. The straight lines are the linear regression trend lines [external fixation: R2 0.652, F(1,5) = 9.369, p = 0.028. Soft tissue procedures: R2 0.630, F(1,5) = 8.508, p = 0.033]