Abstract
The circadian rhythm of human circulating lipid components was studied under nearnormal tropical conditions in 162 healthy volunteers (103 males and 59 females; 7 to 75 years of age). They followed a diurnal activity from about 06:00 to about 22:00 and nocturnal rest. These volunteers were divided into four groups: Group A (7–20 years), Group B (21–40 years), Group C (41–60 years) and Group D (61–75 years), comprising 42, 60, 35 and 25 participants, respectively. A marked circadian rhythm was demonstrated for each studied variable in each group by population-mean cosinor analysis (almost invariably p < 0.001). Furthermore, circadian rhythm characteristics were compared among the 4 groups by parameter tests and regressed as a function of age, separately for males and females. A second-order polynomial characterized the MESOR of HDL cholesterol, phospholipids and total lipids, as well as the 24-h amplitude of total cholesterol and phospholipids. The 24-h amplitude of total lipids decreased linearly with age. The 24-h acrophase of the oldest age group (Group D) was advanced in the case of total cholesterol, HDL cholesterol, and total lipids, whereas that of phospholipids was delayed. Mapping the circadian rhythm (an important component of the broader time structure or chronome, which includes a. o., trends with age and extra-circadian components) of lipid components is needed to explore their role in the aging process in health.
Keywords: Circadian time structure, Cholesterol, Phospholipids, Total lipids, Healthy population, Aging process
Introduction
Cholesterol, phospholipids, and high-density lipoproteins are important constituents of the lipid fraction of the human body. They are important constituents of the cell membrane, also help in the absorption of fat soluble vitamins, and maintain membrane fluidity, acting as a thermal insulator and cellular metabolic regulator. They are precursors of various critical substances, such as adrenal and gonadal steroid hormones and bile acids, vitamin D and organ padding. Metabolomics is one of the ‘‘omics’’ platforms for analyzing comprehensive profiles of small molecule metabolites in cells, tissues, or body fluids such as blood and urine. Metabolomics provides a useful tool to analyze metabolite concentrations in physiological and biological states. It is therefore applied to explore biomarkers for disease diagnosis [1–4] and to assess drug responses and toxicity [5–8]. Various metabolomic approaches are used, and among these, lipidomics includes the comprehensive analysis of lipid metabolites [9, 10]. Lipid metabolites are not only components of cell membranes, but they are also involved in signal transduction [11, 12]. Lipid metabolites are therefore considered potential biomarker candidates for disease diagnosis and drug responses. Indeed, recent lipidomic studies have shown that lipid metabolites such as eicosanoids and sphingolipids are biomarker candidates for cardiovascular events [1], traumatic brain injury [13], Alzheimer’s disease [3, 14], type 2 diabetes [15] and depression [16]. Blood is a commonly used biofluid for biomarker discovery because it is a ‘‘data-rich’’ source containing several thousands of hydrophilic and hydrophobic metabolites that likely reflect many complex biological processes in the body [17]. However, their concentrations and time structure in different age groups have not been extensively studied. There are reports regarding the circadian nature of circulating lipid components in different conditions [18–23]. To our knowledge, the circadian pattern of circulating lipid components has not yet been mapped in healthy Indians. The present study aims to fill this gap by providing reference values for circadian changes of circulating lipid components in different age groups in healthy Indians.
Materials and Methods
One hundred sixty two healthy Indians (103 men and 59 women; 7–75 years of age) volunteered for this study. They followed a 24-h synchronized social schedule with a diurnal activity from about 06:00 to 22:00 and nocturnal rest. They were of equal socioeconomic status (middle income group), residing in the northern part of the country around Lucknow. Most were medical students, staff members and members of their families who had been residing in the region for at least 2 years. At 25.50°, Lucknow is located just north of the Tropic of Cancer. There is seasonality in this part of the country and the average temperature ranges between 10 and 45 °C. Informed consent was obtained from all individual participants included in this study. The volunteers were subdivided into four age groups: A (7–20 years), B (21–40 years), C (41–60 years) and D (61–75 years), comprising 42, 60, 35 and 25 subjects, respectively. All participants followed their usual daily routine, but abstained from strenuous activity, such as sports or other physical exercises on the dates of investigation. All took their usual (although not identical) meals three times daily: breakfast around 08:00, lunch around 13:30 and dinner around 21:00 without any change in their usual fluid intake. The burden of environmental temperature and pollution, if any, was common to all participants. Blood samples were collected in plain and sterile vials containing heparin as anticoagulant every 6 h for 24 h (4 samples) around 06:00, 12:00, 18:00 and 24:00. Plasma was separated and total cholesterol (T-C), high density lipoprotein cholesterol (HDL-C), phospholipid (PL) and total lipids (TL) were measured spectrophotometrically.
Data were evaluated by conventional statistical analyses (Student t test for comparison between the two genders, linear regression for trends as a function of age) and by the single and population-mean-cosinor procedures [24–27] yielding estimates of the MESOR (a chronome-adjusted mean), circadian amplitude (a measure of half the extent of predictable change within a day) and acrophase (a measure of the timing of overall high values recurring each day). Circadian rhythm characteristics were also compared among the 4 age groups by parameter tests [28]. A P value of 0.05 or less was considered to be statistically significant.
Results
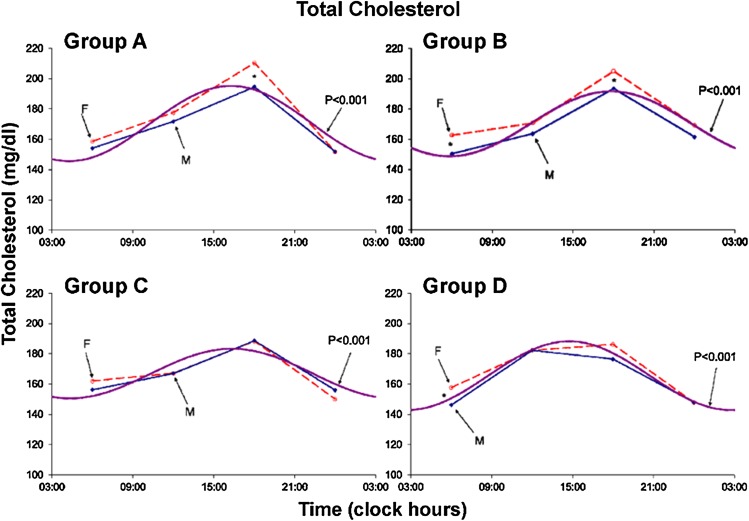
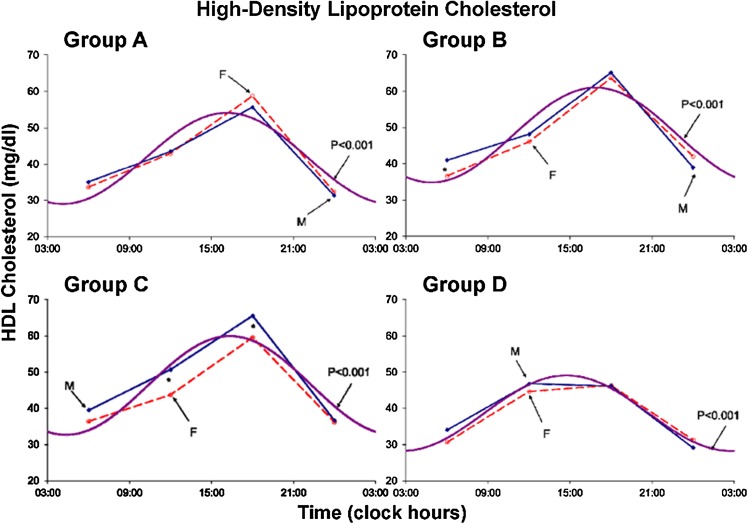
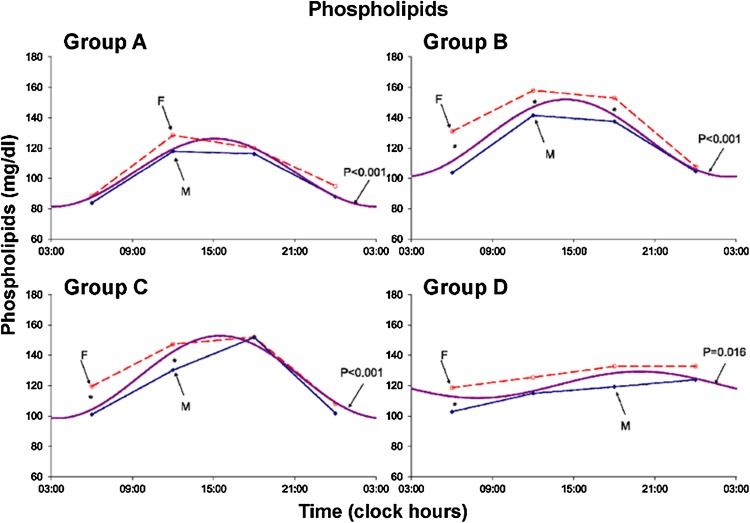
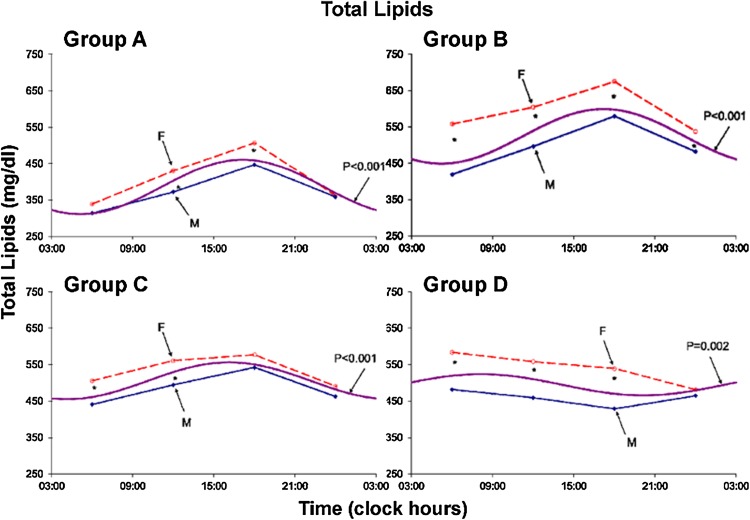
Results are summarized in Tables 1 and 2 and Figs. 1, 2, 3, 4, 5, 6, 7 and 8. A marked circadian variation was recorded for T-C, HDL-C, PL and TL concentrations by population-mean cosinor analysis for all age groups, with changed circadian characteristics in terms of MESOR, circadian amplitude and circadian acrophase (Table 1). In Figs. 1, 2, 3 and 4, time point means are plotted as a function of time, separately for males and females, together with the 24-h cosine curve assessed for all subjects within each age group. Results from Student t tests indicate that T-C is higher in females than in males at 06:00 (Groups B and D; P < 0.005) and at 18:00 (Groups A and B; P < 0.05), HDL-C is higher in males than in females at 06:00 (Group B; P = 0.014) and at 12:00 and 18:00 (Group C; P < 0.05), PL is higher in females than in males at 06:00 (Groups B, C and D; P < 0.05), at 12:00 (Groups A, B and C; P ≤ 0.05) and at 18:00 (Group B; P = 0.007), and TL is higher in females than in males at 06:00, 12:00 and 18:00 (all 4 groups; P ≤ 0.05) and 00:00 (Group B; P = 0.020).
Table 1.
Circadian rhythm characteristics of circulating plasma lipid components in different age groups
| Variable | RhythmometricSummary | ||||||
|---|---|---|---|---|---|---|---|
| Group | k | PR | P | MESOR ± SE | Amplitude (95 % CI) | Acrophase (95 % CI) | |
| T-C | A | 42 | 81.2 | <0.001 | 170.4 ± 2.0 | 24.8 (22.1–27.6) | –244° (–236°,–252°) |
| B | 60 | 81.0 | <0.001 | 170.2 ± 1.5 | 21.5 (19.6,23.4) | –267° (–261°,–274°) | |
| C | 35 | 70.3 | <0.001 | 166.9 ± 1.3 | 16.4 (13.6–19.2) | –245° (–232°,–260°) | |
| D | 25 | 82.0 | <0.001 | 165.5 ± 1.5 | 22.7 (20.2,25.2) | –221° (–213°,–228°) | |
| HDL–C | A | 42 | 77.4 | <0.001 | 41.6 ± 0.7 | 12.6 (11.1–14.0) | –242° (–235°,–250°) |
| B | 60 | 77.9 | <0.001 | 47.9 ± 0.6 | 13.1 (12.1–14.1) | –253° (–247°,–260°) | |
| C | 35 | 80.7 | <0.001 | 46.3 ± 0.7 | 13.6 (12.0–15.2) | –245 (–239°,–253°) | |
| D | 25 | 80.8 | <0.001 | 38.6 ± 1.0 | 10.4 (8.2–12.6) | –221° (–213°,–233°) | |
| PL | A | 42 | 87.4 | <0.001 | 103.8 ± 1.3 | 22.5 (20.0–25.0) | –226° (–217°,–235°) |
| B | 60 | 87.2 | <0.001 | 126.6 ± 1.5 | 25.5 (22.4–28.7) | –216° (–207°,–227°) | |
| C | 35 | 83.1 | <0.001 | 125.7 ± 1.9 | 27.1 (22.9–31.3) | –232° (–222°,–243°) | |
| D | 25 | 76.0 | 0.016 | 120.6 ± 2.5 | 8.7 (2.0–15.4) | –298° (–230°,–333°) | |
| TL | A | 42 | 86.8 | <0.001 | 386.0 ± 7.4 | 75.1 (63.5–86.6) | –257° (–246°,–269°) |
| B | 60 | 81.2 | <0.001 | 524.3 ± 9.3 | 75.1 (65.1–85.1) | –258° (–247°,–269°) | |
| C | 35 | 71.0 | <0.001 | 505.9 ± 6.9 | 50.5 (40.4–60.7) | –242° (–225°,–260°) | |
| D | 25 | 71.0 | =0.002 | 494.9 ± 12.8 | 29.0 (14.4–43.7) | –122° (–90°,–149°) | |
Groups A: 7–20 years; B: 21–40 years; C: 41–60 years; D: 61–75 years
T-C total cholesterol, HDL-C high-density lipoprotein cholesterol, PL phospholipids, TL total lipids, k number of participants, PR percent rhythm–average proportion of variance accounted for by fit of 24-h cosine curve to individual data series, P p value from zero-amplitude (no-rhythm) test, M MESOR–a chronome-adjusted mean value, Amplitude circadian amplitude–measure of half the extent of predictable change within a day, Ø acrophase–measure of the timing of overall high recurring each day–expressed in (negative) degrees with 360° ≡ 24 h and 0° = 00:00, SE standard error, 95 % CI 95 % confidence interval
Table 2.
Comparison of rhythm parameters among different age groups
| Total cholesterol | ||||
|---|---|---|---|---|
| Group | M | A | ϕ | P (H0: A = 0) |
| A | 170.4 | 24.8 | –244 | <0.001 |
| B | 170.2 | 21.5 | –267 | <0.001 |
| C | 166.9 | 16.4 | –245 | <0.001 |
| D | 165.5 | 22.7 | –221 | <0.001 |
| Tests of equality of parameters among groups: F (P) | (A–ϕ) | |||
| All 4 groups | 1.797 (0.150) | 8.331 (< 0.001) | 18.611 (< 0.001) | 12.790 (< 0.001) |
| B versus A | 0.009 (0.926) | 4.503 (0.036) | 20.706 (< 0.001) | 10.697 (< 0.001) |
| C versus B | 2.239 (0.138) | 9.941 (0.002) | 8.920 (0.004) | 10.335 (< 0.001) |
| D versus C | 0.519 (0.474) | 10.467 (0.002) | 10.257 (0.002) | 7.406 (0.001) |
| D versus A | 2.937 (0.091) | 1.358 (0.248) | 13.831 (< 0.001) | 8.268 (< 0.001) |
| High-density lipoprotein cholesterol | ||||
|---|---|---|---|---|
| Group | M | A | ϕ | P (H0: A = 0) |
| A | 41.6 | 12.6 | –242 | <0.001 |
| B | 47.9 | 13.1 | –253 | <0.001 |
| C | 46.3 | 13.6 | –245 | <0.001 |
| D | 38.7 | 10.4 | –221 | <0.001 |
| Tests of equality of parameters among groups: F (P) | (A–ϕ) | |||
| All 4 groups | 30.616 (< 0.001) | 2.928 (0.036) | 7.341 (< 0.001) | 8.583 (< 0.001) |
| B versus A | 44.502 (< 0.001) | 0.365 (0.547) | 4.350 (0.040) | 3.163 (0.044) |
| C versus B | 2.731 (0.102) | 0.380 (0.539) | 2.362 (0.128) | 1.166 (0.314) |
| D versus C | 39.561 (< 0.001) | 6.564 (0.013) | 13.400 (0.001) | 15.082 (< 0.001) |
| D versus A | 5.688 (0.020) | 3.250 (0.076) | 8.993 (0.004) | 8.379 (< 0.001) |
| Phospholipids | ||||
|---|---|---|---|---|
| Group | M | A | ϕ | P (H0: A = 0) |
| A | 103.8 | 22.5 | –226 | <0.001 |
| B | 126.6 | 25.5 | –216 | <0.001 |
| C | 125.7 | 27.1 | –232 | <0.001 |
| D | 120.6 | 8.7 | –298 | 0.016 |
| Tests of equality of parameters among groups: F (P) | (A–ϕ) | |||
| All 4 groups | 41.486 (< 0.001) | 16.853 (< 0.001) | 4.067 (0.008) | 14.150 (< 0.001) |
| B versus A | 116.902 (< 0.001) | 2.092 (0.151) | 1.602 (0.209) | 1.245 (0.290) |
| C versus B | 0.115 (0.735) | 0.441 (0.508) | 4.410 (0.038) | 3.278 (0.040) |
| D versus C | 2.874 (0.095) | 35.105 (< 0.001) | 5.527 (0.022) | 20.262 (< 0.001) |
| D versus A | 45.853 (< 0.001) | 32.831 (< 0.001) | 7.831 (0.007) | 21.586 (< 0.001) |
| Total lipids | ||||
|---|---|---|---|---|
| Group | M | A | ϕ | P (H0: A = 0) |
| A | 386.0 | 75.1 | –257 | <0.001 |
| B | 524.3 | 75.1 | –258 | <0.001 |
| C | 505.9 | 50.5 | –242 | <0.001 |
| D | 494.9 | 29.0 | –122 | 0.002 |
| Tests of equality of parameters among groups: F (P) | (A–ϕ) | |||
| All 4 groups | 50.049 (< 0.001) | 15.967 (<0.001) | NA | 21.348 (< 0.001) |
| B versus A | 119.305 (< 0.001) | <0.001 (0.994) | 0.021 (0.886) | 0.010 (0.990) |
| C versus B | 1.942 (0.167) | 11.157 (0.001) | 2.222 (0.139) | 6.383 (0.002) |
| D versus C | 0.686 (0.411) | 17.543 (< 0.001) | NA | 31.106 (< 0.001) |
| D versus A | 65.238 (< 0.001) | 39.953 (< 0.001) | NA | 46.594 (< 0.001) |
M MESOR, A 24-h amplitude, ϕ 24-h acrophase (360° ≡ 24 h, 0°: 00:00) NA not applicable (acrophases more than 180° apart, P < 0.05 if 95 % confidence intervals do not overlap)
Fig. 1.
Circadian rhythm in total plasma cholesterol concentration assessed in 4 age groups–separately for males (solid lines) and females (dashed lines). Values are higher (P < 0.05) in females than in males at 06:00 (groups B and D) and at 18:00 (groups A and B)
Fig. 2.
Circadian rhythm in plasma HDL-Cholesterol concentration assessed in 4 age groups–separately for males (solid lines) and females (dashed lines). Values are higher (P < 0.05) in males than in females at 06:00 (group B) and at 12:00 and 18:00 (group C)
Fig. 3.
Circadian rhythm in plasma phospholipids concentration assessed in 4 age groups–separately for males (solid lines) and females (dashed lines). Values are higher (P < 0.05) in females than in males at 06:00 (groups B–C and D)–at 12:00 (groups A–B and C)–and at 18:00 (group B)
Fig. 4.
Circadian rhythm in plasma total lipids concentration assessed in 4 age groups–separately for males (solid lines) and females (dashed lines). Values are higher (P < 0.05) in females than in males at 06:00–12:00 and 18:00 (all groups; A: P = 0.057)–and 00:00 (group B)
Fig. 5.
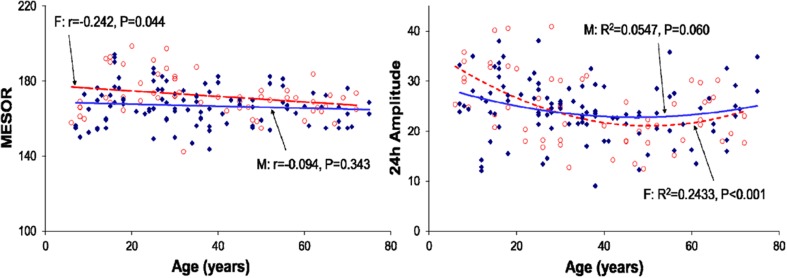
Regression of the MESOR (left) and 24-h amplitude (right) of total cholesterol with age (all groups pooled)–separately for males (filled diamonds) and females (open circles). The 24-h acrophase is delayed with advancing age (M: P = 0.067–F: P = 0.039; not shown)
Fig. 6.
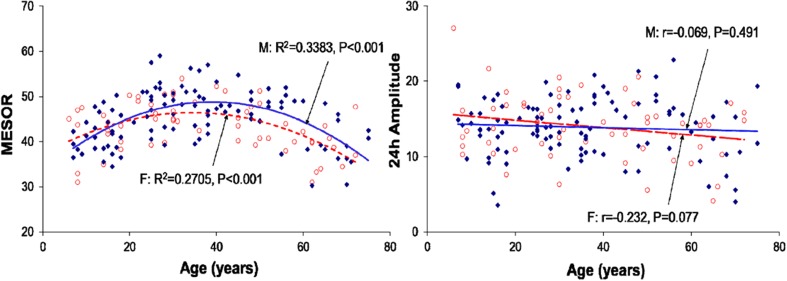
Regression of the MESOR (left) and 24-h amplitude (right) of HDL cholesterol with age (all groups pooled)–separately for males (filled diamonds) and females (open circles)
Fig. 7.
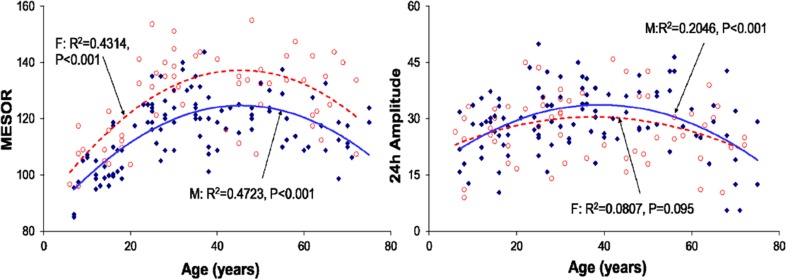
Regression of the MESOR (left) and 24-h amplitude (right) of phospholipidswith age (all groups pooled)–separately for males (filled diamonds) and females (open circles). The 24-h acrophase is advanced with increasing age (M: P < 0.001–F: P = 0.034; not shown)
Fig. 8.
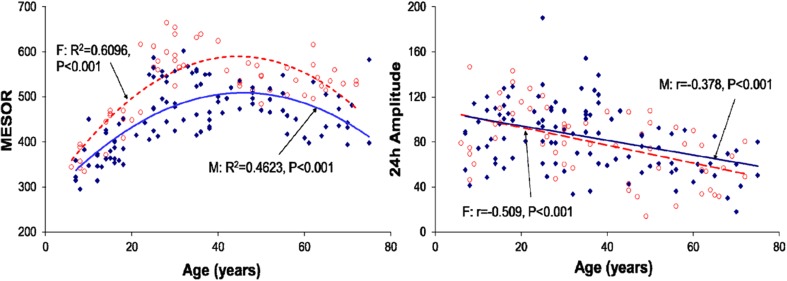
Regression of the MESOR (left) and 24-h amplitude (right) of total lipidswith age (all groups pooled)–separately for males (filled diamonds) and females (open circles)
Figures 5, 6, 7 and 8 display changes in the MESOR and 24-h amplitude of each variable as a function of age, separately for males and females. Parameter tests performed on pooled data from both genders indicated that trends with age were not necessarily linear. A second-order polynomial fitted the data better in some cases, as evidenced also from results of parameter tests, summarized in Table 2.
The MESOR of T-C did not change statistically significantly with age. The 24-h amplitude of T-C reached a minimum in Group C: it is smaller in Group B than in Group A (P = 0.036), smaller in Group C than in Group B (P = 0.002), but larger in Group D than in Group C (P = 0.002), with no statistically significant difference between Groups A and D. The 24-h acrophase of T-C was delayed in Group B versus Group A (P < 0.001), but advanced in Group C versus Group B (P = 0.004) and in Group D versus Group C (P = 0.002) as well as versus Group A (P < 0.001).
The MESOR of HDL-C reached a maximum in Group B, being higher in Group B than in Group A (P < 0.001) but lower in Group D than in Group C (P < 0.001), with no statistically significant differences between Groups B and C and between Groups A and D. The 24-h amplitude of HDL-C reached a maximum in Group C.A difference is only found between Groups C and D (P = 0.013). The 24-h acrophase of HDL-C is delayed in Group B versus Group A (P = 0.040) but advanced in Group D versus the other 3 groups (P < 0.001).
The MESOR of PL reached a maximum in Group B, being higher in Group B than in Group A (P < 0.001) and Group A also being lower than Group D (P < 0.001).The 24-h amplitude of PL peaks in Group C. Whereas there is no statistically significant change between Groups A and B or between Groups B and C, Group D is characterized by a smaller 24-h amplitude than Group C (P < 0.001) and Group A (P < 0.001).The 24-h acrophase of PL is slightly delayed in Group C versus Group B (P = 0.038) and it is considerably delayed in Group D versus Group C (P = 0.022) and versus Group A (P = 0.007).
The MESOR of TL reached a maximum in Group B, being higher in Group B than in Group A (P < 0.001). Whereas there is no statistically significant difference between Groups B and C or between Groups C and D, it is lower in Group A than in Group D (P < 0.001).The 24-h amplitude of TL starts decreasing in Group C. With no difference between Groups A and B, it is smaller in Group C than in Group B (P = 0.001) and smaller in Group D than in Group C (P < 0.001).The 24-h acrophase of TL is considerably advanced in Group D as compared to the other 3 groups (P < 0.001).
Discussion
A marked circadian variation was recorded in plasma T-C, HDL-C, PL and TL concentrations in healthy Indians of different age groups. The circadian acrophase of T-C occurred 2 h earlier in the 61–75-year old age group, as compared to the 21–40-year old age group and 1 h earlier as compared to the 7–20- and 41–60-year old groups. The circadian amplitude of T-C was statistically significantly smaller in the 41-60-year-old age group as compared to the other 3 groups. The T-C concentration was noted to be almost invariably numerically higher in healthy females of different age groups by comparison to their male counterparts, the difference being primarily statistically significant around 18:00 in the 2 younger age groups. The MESOR declined slightly with age in females (P = 0.044) but the trend was not significant in males. The change with age in the 24-h amplitude was characterized by a second-order polynomial that was statistically significant in female volunteers but only reached borderline significance in males (Figs. 1, 5).
HDL-C concentrations also exhibited marked circadian variations in all studied age groups (P < 0.001; Table 1). As opposed to T-C, HDL-C tended to be higher in males than in females, the difference being statistically significant only at 06:00 in the 21–40-year group and at 12:00 and 18:00 in the 41–60-year group (Fig. 2). The MESOR changed nonlinearly with age, reaching a maximum in middle adulthood and being decreased in the older age group (Fig. 6). The trend with age in the circadian amplitude was not significant, but parameter tests found that it was also decreased in the older age group (Fig. 6).
Plasma PL concentrations were also characterized by a circadian rhythm in all age groups. Females had numerically higher values than males, the difference being most pronounced in the 21–40-year group from 06:00 to 18:00 and in the 41–60-year group between 06:00 and 12:00 (Fig. 3). Both the MESOR and the circadian amplitude of PL changed nonlinearly with age, reaching a maximum in middle adulthood and being decreased in the older age group (Fig. 7).
Plasma TL was also characterized by a circadian rhythm in all age groups. It was markedly higher in females than in males, the difference almost invariably reaching statistical significance from 06:00 to 18:00 in all age groups (Fig. 4). The MESOR was highest in the 21–40-year group and the circadian amplitude started to be decreased after 40 years of age (Fig. 8).
Inter-group differences in MESOR and circadian amplitude observed for the lipid components examined herein may be related to differences in societal traditions and rest/activity schedules, among others. On average, plasma T-C, PL and TL tended to be higher in female participants, whereas HDL-C concentration tended to be lower at all sampled time points. It appears that females synthesize relatively more lipids than do healthy males of different age groups. HDL-C is a known antioxidant and the lower concentration of HDL-C in healthy women of all age groups may be related to greater family responsibility, including day-to-day house maintenance and care. This difference may also be related to differences in fluid intake, hormonal differences between the two genders, working habits, climatic conditions, body weight and meal schedules, dietary factors (such as ingestion of excessive calories, saturated fatty acids and cholesterol), or ingestion of drugs, among other factors. Our observations are in agreement with other reports [23, 29]. Similarly, a marked circadian rhythm has been reported in plasma circulating lipid components under different conditions in healthy Indians [21, 22]. Kochhar et al. [30] reported higher rates of lipid biosynthesis in females in comparison to males; however, overall lipid biosynthesis was observed to be decreased in females with increasing age. The present observations are in agreement with their reports regarding overall higher concentrations in female than in male participants of different age groups. A tendency for the circadian amplitude to decrease and the acrophase to advance in older age group was observed for all circulating lipid components, except for phospholipids in which case the circadian acrophase was delayed in the oldest age group. Circulating lipid components, like any other essential components of the body, attract clinical attention when present in abnormal concentrations. Increased or decreased concentrations usually occur because of abnormalities in the synthesis, degradation, and transport of their associated lipoprotein particles. The observed circadian rhythm in the studied variables in the present study could be due to certain rhythms in their metabolism and degradative pathways with the aging process. Mapping the circadian rhythm (an important component of the broader time structure or chronome, which includes a. o., trends with age and extra-circadian components) of plasma lipid components will be significant to investigate their role in the aging process in health.
Compliance with Ethical Standards
Conflict of interest
None.
Contributor Information
Ranjana Singh, Email: ranjanasingh.2509@rediffmail.com.
Raj K. Singh, Email: singhrk23a@hotmail.com
References
- 1.Liu JY, Li N, Yang J, Li N, Qiu H, Ai D, et al. Metabolic profiling of murine plasma reveals an unexpected biomarker in rofecoxib-mediated cardiovascular events. Proc Natl Acad Sci USA. 2010;107:17017–17022. doi: 10.1073/pnas.1011278107. [DOI] [PMC free article] [PubMed] [Google Scholar]
- 2.Vouk K, Hevir N, Ribic´-Pucelj M, Haarpaintner G, Scherb H, Osredkar J, et al. Discovery of phosphatidylcholines and sphingomyelins as biomarkers for ovarian endometriosis. Hum Reprod. 2012;27:2955–2965. doi: 10.1093/humrep/des152. [DOI] [PubMed] [Google Scholar]
- 3.Sato Y, Suzuki I, Nakamura T, Bernier F, Aoshima K, Oda Y. Identification of a new plasma biomarker of Alzheimer’s disease using metabolomics technology. J Lipid Res. 2012;53:567–576. doi: 10.1194/jlr.M022376. [DOI] [PMC free article] [PubMed] [Google Scholar]
- 4.Seijo S, Lozano JJ, Alonso C, Reverter E, Miquel R, Abraldes JG, et al. Metabolomics discloses potential biomarkers for the noninvasive diagnosis of idiopathic portal hypertension. Am J Gastroenterol. 2013;108:929–932. doi: 10.1038/ajg.2013.11. [DOI] [PubMed] [Google Scholar]
- 5.Soga T, Baran R, Suematsu M, Ueno Y, Ikeda S, Sakarukawa T, et al. Differential metabolomics reveals ophthalmic acid as an oxidative stress biomarker indicating hepatic glutathione consumption. J Biol Chem. 2006;281:16768–16776. doi: 10.1074/jbc.M601876200. [DOI] [PubMed] [Google Scholar]
- 6.Beger RD, Sun J, Schnackenberg LK. Metabolomics approaches for discovering biomarkers of drug-induced hepatotoxicity and nephrotoxicity. Toxicol Appl Pharmacol. 2010;243:154–166. doi: 10.1016/j.taap.2009.11.019. [DOI] [PubMed] [Google Scholar]
- 7.Parman T, Bunin DI, Ng HH, McDunn JE, Wulff JE, Wang A, et al. Toxicogenomics and metabolomics of pentamethylchromanol (PMCol)-induced hepatotoxicity. Toxicol Sci. 2011;124:487–501. doi: 10.1093/toxsci/kfr238. [DOI] [PMC free article] [PubMed] [Google Scholar]
- 8.McClay JL, Adkins DE, Vunck SA, Batman AM, Vann RE, Clark SL, et al. Large scale neurochemical metabolomics analysis identifies multiple compounds associated with methamphetamine exposure. Metabolomics. 2013;9:392–402. doi: 10.1007/s11306-012-0456-y. [DOI] [PMC free article] [PubMed] [Google Scholar]
- 9.Han X, Gross S. Shotgun lipidomics: electrospray ionization mass spectrometri analysis and quantitation of cellular lipidomes directly from crude extracts of biological samples. Mass Spectrom Rev. 2005;24:367–412. doi: 10.1002/mas.20023. [DOI] [PubMed] [Google Scholar]
- 10.Taguchi R, Nishijima M, Shimizu T. Basic analytical systems for lipidomics by mass spectrometry in Japan. Methods Enzymol. 2007;432:185–211. doi: 10.1016/S0076-6879(07)32008-9. [DOI] [PubMed] [Google Scholar]
- 11.Spiegel S, Milstien S. Sphingosine-1-phosphate: an enigmatic signaling lipid. Nat Rev Mol Cell Biol. 2003;4:397–407. doi: 10.1038/nrm1103. [DOI] [PubMed] [Google Scholar]
- 12.Serhan CN, Chiang N, Van Dyke TE. Resolving inflammation: dual antiinflammatoryand pro-resolution lipid mediators. Nat Rev Immunol. 2008;8:349–361. doi: 10.1038/nri2294. [DOI] [PMC free article] [PubMed] [Google Scholar]
- 13.Sparvero LJ, Amoscato AA, Kochanek PM, Pitt BR, Kagan VE, Bayir H. Mass-spectrometry based oxidative lipidomics and lipid imaging: applications in traumatic brain injury. J Neurochem. 2010;115:1322–1336. doi: 10.1111/j.1471-4159.2010.07055.x. [DOI] [PMC free article] [PubMed] [Google Scholar]
- 14.Han X, Rozen S, Boyle SH, Hellegers C, Cheng H, Burke JR, et al. Metabolomics in early Alzheimer’s disease: identification of altered plasma sphingolipidome using shotgun lipidomics. PLoS ONE. 2011;6:e21643. doi: 10.1371/journal.pone.0021643. [DOI] [PMC free article] [PubMed] [Google Scholar]
- 15.Wang-Sattler R, Yu Z, Herder C, Messias AC, Floegel A, He Y, Heim K. Novel biomarkers for pre-diabetes identified by metabolomics. Mol Syst Biol. 2012;8:615. doi: 10.1038/msb.2012.43. [DOI] [PMC free article] [PubMed] [Google Scholar]
- 16.Demirkan A, Isaacs A, Uqocsai P, Liebisch G, Struchalin M, Rudan I, et al. Plasmaphosphatidylcholine and sphingomyelin concentrations are associated withdepression and anxiety symptoms in a Dutch family-based lipidomics study. J Psychiatr Res. 2013;47:357–362. doi: 10.1016/j.jpsychires.2012.11.001. [DOI] [PubMed] [Google Scholar]
- 17.Wishart DS, Jewison T, Guo AC, Wilson M, Knox C, Liu Y, et al. HMDB 3.0—the human metabolome database in 2013. Nucleic Acid Res. 2013;41:D801–D807. doi: 10.1093/nar/gks1065. [DOI] [PMC free article] [PubMed] [Google Scholar]
- 18.Rivera-Coll A, Fuentes-Arderiu X, Díez-Noguera A. Circadian rhythmic variations in serum concentrations of clinically important lipids. Clin Chem. 1994;40:1549–1553. [PubMed] [Google Scholar]
- 19.Kessler Cella L, Van Cauter E, Schoeller DA. Diurnal rhythmicity of human cholesterol synthesis: normal pattern and adaptation to simulated “jet lag”. Am J Physiol. 1995;269:E489–E498. doi: 10.1152/ajpendo.1995.269.3.E489. [DOI] [PubMed] [Google Scholar]
- 20.Kessler Cella L, Van Cauter E, Schoeller DA. Effect of meal timing on diurnal rhythm of human cholesterol synthesis. Am J Physiol. 1995;269:E878–E880. doi: 10.1152/ajpendo.1995.269.5.E878. [DOI] [PubMed] [Google Scholar]
- 21.Singh RK, Wu J, Zhou S, Halberg F. Circadian rhythmic human circulating cholesterol in health, during fasting and on vegetarian vs. omnivorous diets. Chronobiologia. 1989;16:183. [Google Scholar]
- 22.Singh RK, Mahdi AA, Singh AK, Bansal SK, Wu J, Zhou S, Halberg F. Circadian variation of human circulating cholesterol components on vegetarian and omnivorous diets in healthy Indians. Indian J Clin Biochem. 1992;7:185–192. doi: 10.1007/BF02886676. [DOI] [Google Scholar]
- 23.Cornelissen G, Galli C, Halberg F, Meester FDE, Rise P, Wilczynska-Kwiatek A, et al. Circadian time structure of fatty acids and vascular monitoring. J Applied Biomed. 2010;8:93–109. doi: 10.2478/v10136-009-0014-8. [DOI] [Google Scholar]
- 24.Halberg F. Chronobiology: methodological problems. Acta Med Rom. 1980;18:399–440. [Google Scholar]
- 25.Cornelissen G, Halberg F. Chronomedicine. In: Armitage P, Colton T, editors. Encyclopedia of biostatistics. 2. Chichester: Wiley; 2005. pp. 796–812. [Google Scholar]
- 26.Refinetti R, Cornelissen G, Halberg F. Procedures for numerical analysis of circadian rhythms. Biological Rhythm Res. 2007;38(4):275–325. doi: 10.1080/09291010600903692. [DOI] [PMC free article] [PubMed] [Google Scholar]
- 27.Cornelissen G. Cosinor-based rhythmometry. Theoretical Biology and Medical Modelling. 2014;11:16–40. doi: 10.1186/1742-4682-11-16. [DOI] [PMC free article] [PubMed] [Google Scholar]
- 28.Bingham C, Arbogast B, Cornelissen G, Lee JK, Halberg F. Inferential statistical methods for estimating and comparing cosinor parameters. Chronobiologia. 1982;9:397–439. [PubMed] [Google Scholar]
- 29.Isabelle C, Josaiane S, Thomas M, Gerard S. Variations in total phospholipid and HDL-phospholipids in plasma from a general population: reference intervals and influence of xenobiotics. Clin Chem. 1985;31(5):763–766. [PubMed] [Google Scholar]
- 30.Kochhar S, Doris M. Jacobs, Ziad Ramadan. Probing gender-specific metabolism differences in humans by nuclear magnetic resonance-based metabonomics. Anal Biochem. 2006;352(2):274–281. doi: 10.1016/j.ab.2006.02.033. [DOI] [PubMed] [Google Scholar]


