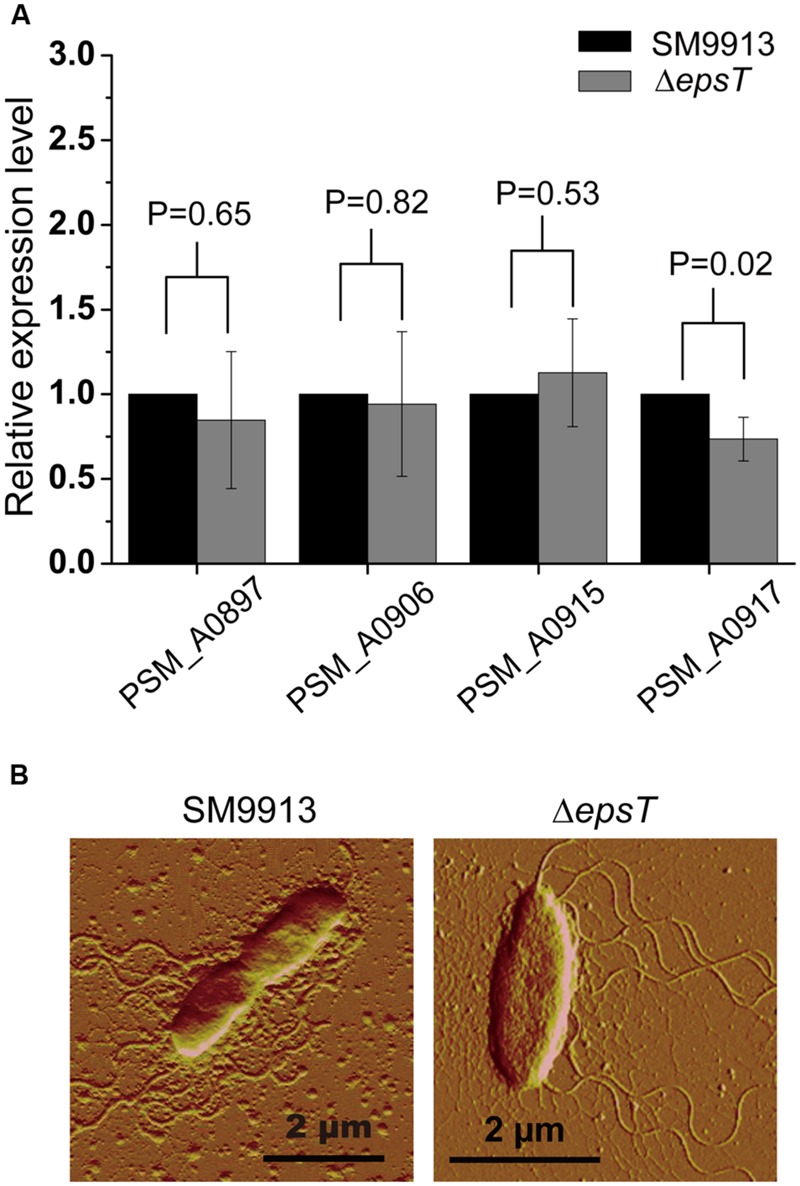
FIGURE 4.

Comparisons of lateral flagella biosynthesis between ΔepsT and wild SM9913 swarming cells. (A) The relative expression levels of four lateral flagella genes in ΔepsT and wild SM9913 swarming cells analyzed by real-time quantitative PCR. The data were from three independent experiments with three replicates (mean ± SD). P-value of each gene was calculated from t-test and was indicated. (B) The lateral flagella of wild SM9913 and ΔepsT observed by atomic force microscopy. Cells were taken from the edge of a swarming colony and imaged by atomic force microscopy.
