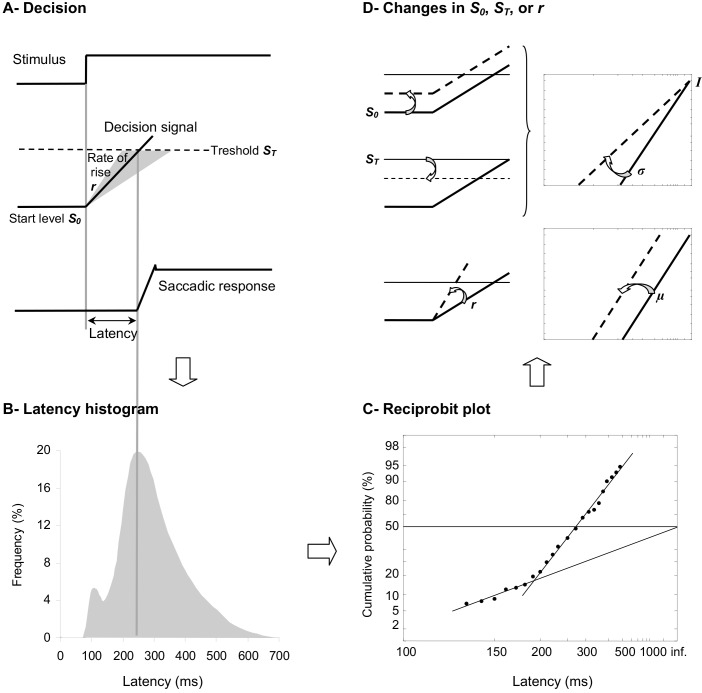
Figure 1.
(A) LATER model. From bottom to the top, we show the saccade position signal, the theoretical decision signal in a LATER unit, and the stimulus signal. In response to the Stimulus, the Decision signal initiates at the Start level S0, increases at a Rate of rise r, until it reaches the Threshold ST at which the Saccadic response begins. (B) Traditional histogram of Frequency (in %) as a function of Latency (in ms). The main distribution is skewed with a tail to the right and some population of express saccades can exhibit a distinct peak. (C) Resulting reciprobit plot of Cumulative probability on a probit scale (in %) as a function of Latency on a reciprocal scale (in ms). The main recinormal distribution lies on a straight line described by μ and σ. Early saccades can occur lying on a second line described by σ’. (D) Changes that can occur in LATER. A change in the distance between S0 and ST results in a swivel of the recinormal distribution around the intercept (up). A change in the rate of rise r results in a lateral shift of the recinormal distribution (down).

