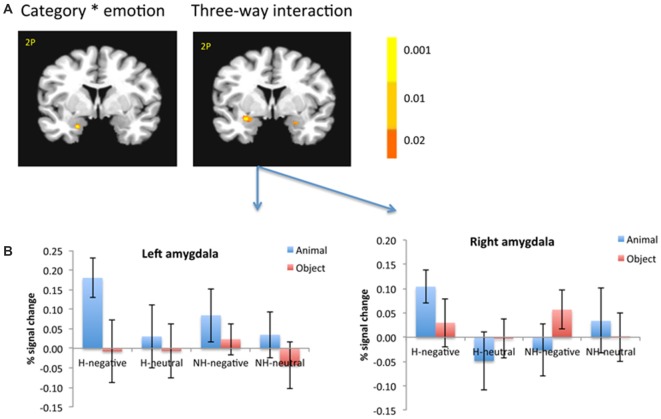
Figure 5.
The amygdala showed significant interaction between category and emotion, and three-way interaction (A). The amygdala was selected from the significant three-way interaction, then the beta weights of each subject from the amygdala clusters were extracted and averaged across subjects (B). The color bar represents p-values for F-statistics of interactions (A). The left is on the left side. The error bars represent the standard errors of the means. The number/alphabet combinations at the top left corner of each brain image refer to the y-coordinates in the standard Talaraich atlas.

