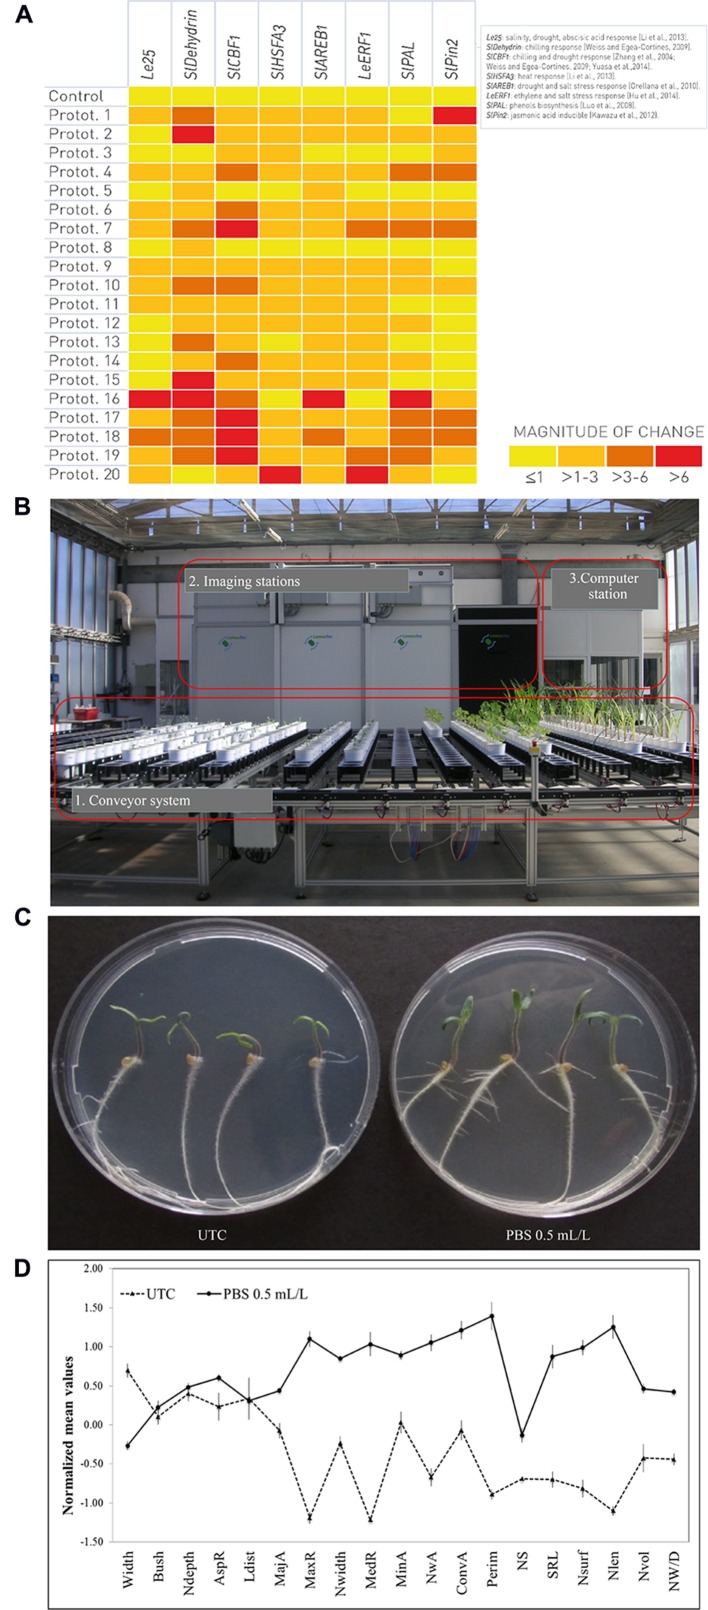
FIGURE 2.
Genomic, phenomic, and in vitro platforms to screen the effect of a set of different natural extracts-based prototypes using tomato (Solanum lycopersicum L.) cv. Microtom as plant model. (A) Relative abundance of mRNA transcripts of markers for specific physiological processes in response to a range of treatments with biostimulant prototypes (Protot.). Transcript levels (signal intensities) are presented in the form of a heat-map (using HeatMapper Plus Tool), on a color scale between low (yellow) and high (red). (B) LemnaTec-Scanalyzer 3D System placed at ALSIA – Metapontum Agrobios Research Center (Matera, Italy). The physiological and morphometric parameters that can be measured using plant phenomics are UV (Ultraviolet) to fluorescence, photosynthesis and health index; RGB (Red-Green-Blue) to plant morphology, architecture, digital biomass and green/yellow index; NIR (Near-Infrared) to plant water content. (C) Comparison of UTC (untreated control) and PBS-treated (final concentration of 0.5 mL/L) plants grown on agar-based medium. (D) Root phenotype differentiation, based on imaging analysis software GiA Roots (Galkovskyi et al., 2012), comparing UTC (untreated control) with PBS-treated (final concentration of 0.5 mL/L) plants. Traits displayed are: Average root width (Width), Bushiness (Bush), Network Depth (Ndepth), Aspect ratio (AspR), Network length distribution (Ldist), Major Ellipse Axis (MajA), Maximum number of roots (MaxR), Network width (Nwidth), Median number of roots (MedR), Minor Ellipse Axis (MinA), Network Area (NwA), Network Convex Area (ConvA), Network perimeter (Perim), Network solidity (NS), Specific root length (SRL), Nsurf (Network surface area), Network length (Nlen), Netwok volume (Nvol) and Network width to depth ratio (NW/D). The error bars indicate the standard error of the mean.

