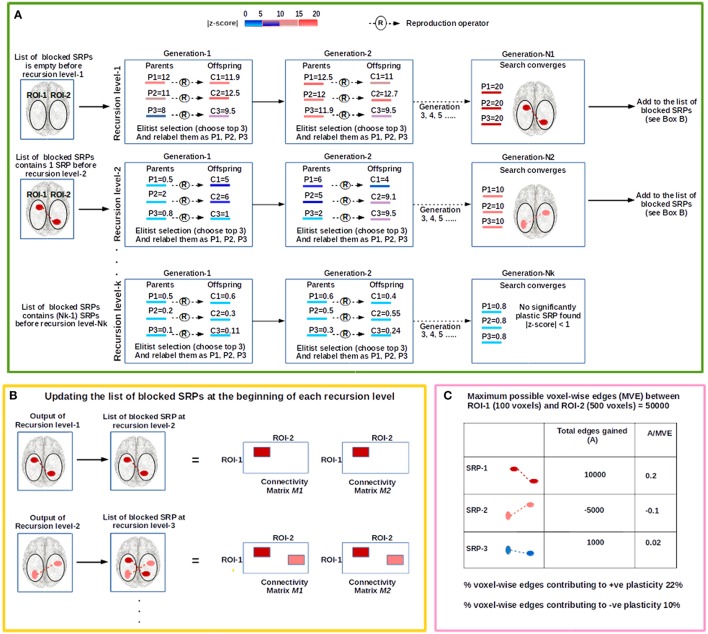
Figure 2.
The figure illustrates the steps involved in the evolutionary computation (EC) based procedure to examine plasticity between an investigator defined ROI-pair (shown as the oval shaped white regions on the brain image), ROI-1 and ROI-2. (A) The procedure begins at recursion level-1 where the evolutionary search for a significantly plastic sub-regional-pair (SRP) is conducted. In this illustration, the population size (number of parental chromosomes) is 3, and each parental chromosome (P1, P2, and P3) produces 3 offspring (C1, C2, and C3). Based on population-elitist selection the top 3 chromosomes are chosen for the next generation, and relabeled as P1, P2, and P3 in a descending order of fitness. The color of each chromosome represents its fitness (|Z-score|); the higher the fitness of the chromosome, greater is the change in the connectivity strength between the sub-ROIs that the chromosome encodes. At the end of recursion level-1, a significantly plastic SRP is detected (SRP-1; shown in dark-red) and the chromosome encoding this SRP is stored in a file. SRP-1 is then added to the list of blocked SRPs, and therefore, at the beginning of recursion level-2 the list contains one blocked SRP; EC will not converge to this solution at recursion level-2. At recursion level-2 a new search begins, and SRP-2 (show in light-red) is detected. For recursion level-3, SRP-1 and SRP-2 are blocked. The recursive process stops at recursion level-K when no significantly plastic SRP is found. (B) To block a SRP all the voxel-wise edges between the SRP are deleted from connectivity matrices (See Section Developing Subject-Specific Connectivity Matrices), M1 and M2 (shown as colored rectangular patches). (C) We illustrate an example consisting of 3 significantly plastic SRPs to show how plasticity estimates are derived.

