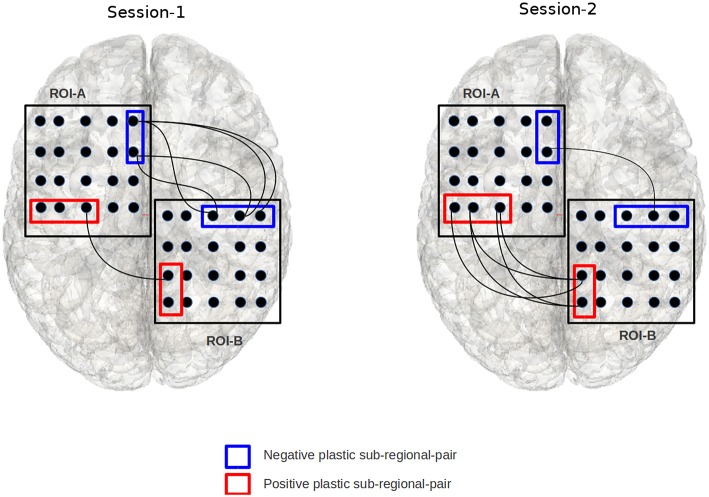
Figure 4.
The figure illustrates an example of a positively and negatively plastic sub-regional-pair. In this figure, session-1 and session-2 refers to two fMRI-scan sessions that are separated by finite duration of time; chronologically, session-2 occurs after session-1. Edges indicate a voxel from ROI-A is significantly correlated with a voxel from ROI-B. The red sub-regional-pair gains functional edges from session-1 to session-2 (hence positive plastic), while the blue sub-regional-pair shows decline in the number of functional edges (hence negative plastic). The binomial test based objective functional detects such plastic sub-regional-pairs.

