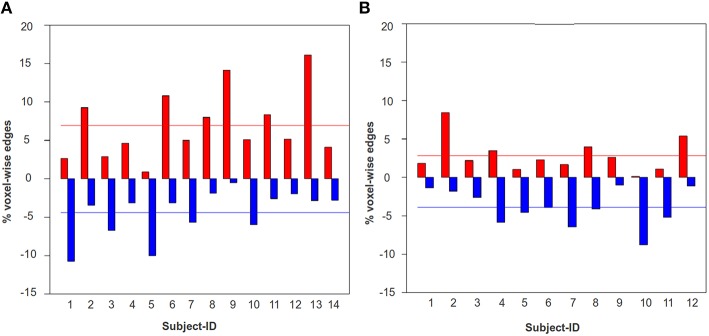
Figure 7.
The percentage of total voxel-wise connections between DMN-frontal right and ECN-frontal right that contributed to statistically significant positive (red) and negative (blue) plasticity. A similar trend was observed for the ROI-pairs, DMN-frontal left and ECN frontal left, and DMN-frontal right and ECN frontal left. (A) The bar-graph illustrates the percentage of total voxel-wise edges that contributed to positive (red) and negative (blue) plasticity for each TBI subject. (B) The bar-graph illustrates the percentage of total voxel-wise edges that contributed to positive (red) and negative (blue) plasticity for each HC subject. The red and the blue horizontal lines indicate the mean positive and negative plasticity level across a group, respectively. The mean positive plasticity for the TBI was significantly higher than the controls.

