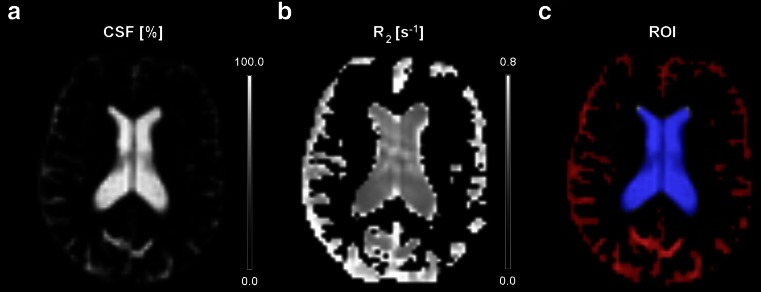
Fig. 1.
A ) CSF M0 map; the signal in each voxel is scaled to pure ventricular voxels to estimate the partial volume effect from which the CSF volume can be calculated. B ) R2 (= the inverse of the T2) CSF map. C ) Regions of interest used to retrieve the peripheral subarachnoidal (red) and ventricular T2, CSF values

