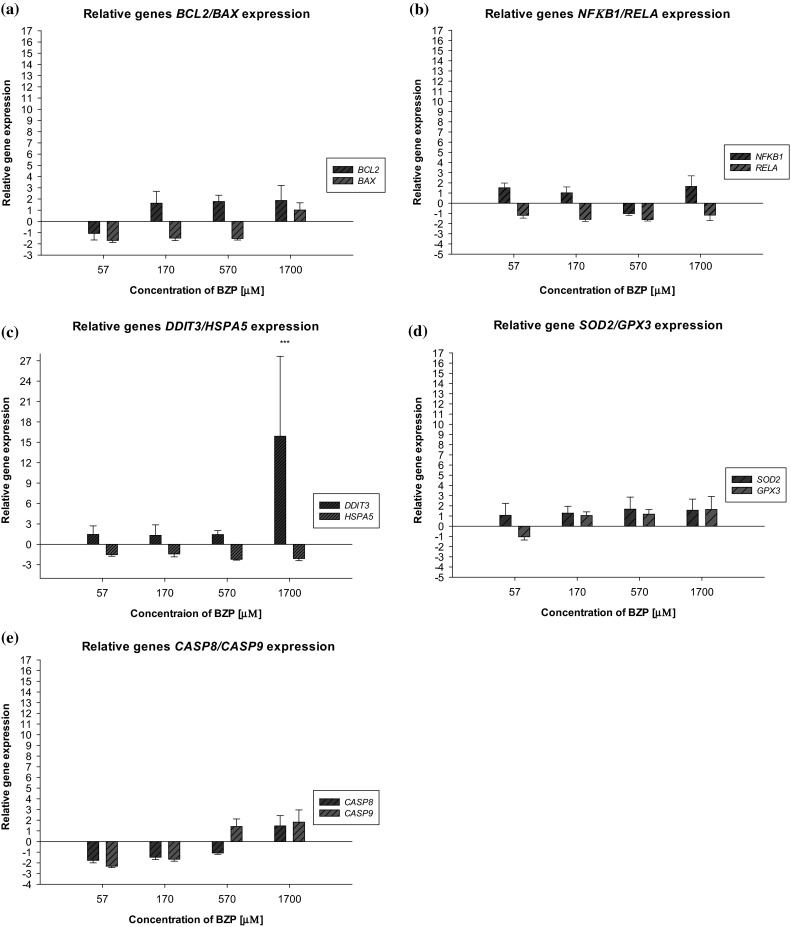
Fig. 5.

Influence of BZP on the changes in the level of relative gene expression. a BCL2/BAX; b NFκB1/RELA, c DDIT3/HSPA5, d SOD2/GPX3, and e CASP8/CASP9 in the cells of the LN-18 line (n = 3–4, pair-wise fixed randomisation Test© versus contr. *p < 0.05; ***p ≤ 0.001)
