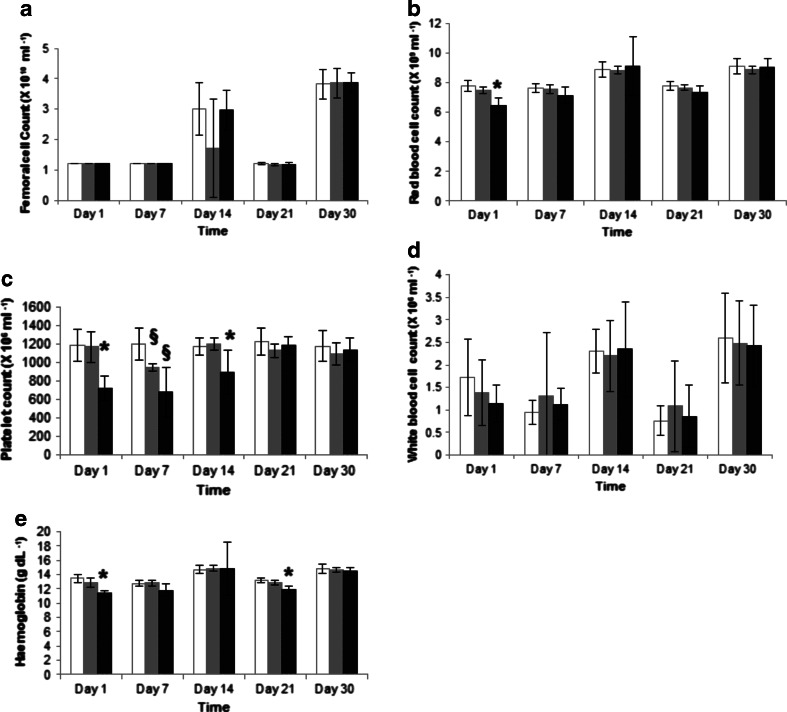
Fig. 5.
Mice blood cell counts and haemoglobin assessments following 10 daily doses of lomustine formulations: white bar = control animals, grey bar = ethanolic lomustine formulation (1.2 mg kg−1), black bars = MET lomustine (13 mg kg−1), * = statistically significantly different from all formulations, § = statistically significantly different from control animals (untreated).

