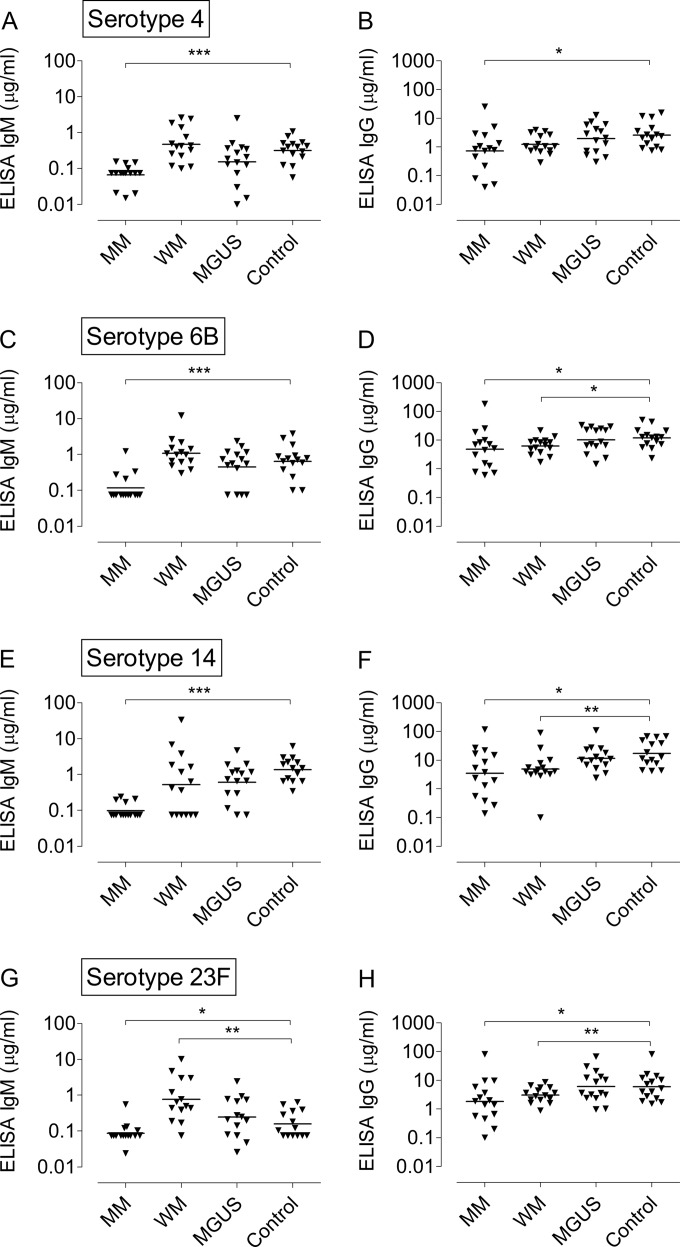
FIG 3.
(A, C, E, and G) ELISA IgM titers after pneumococcal vaccination. (B, D, F, and H) Corresponding IgG titers are shown for comparison. Each triangle represents one study person. Horizontal bars denote the geometric mean value for each study group. (A and B) Serotype 4. (C and D) Serotype 6B. (E and F) Serotype 14. (G and H) Serotype 23F. Statistical comparisons have been performed for the respective patient groups versus the control group. *, P < 0.05; **, P < 0.01; ***, P < 0.001 (Mann-Whitney U test).

