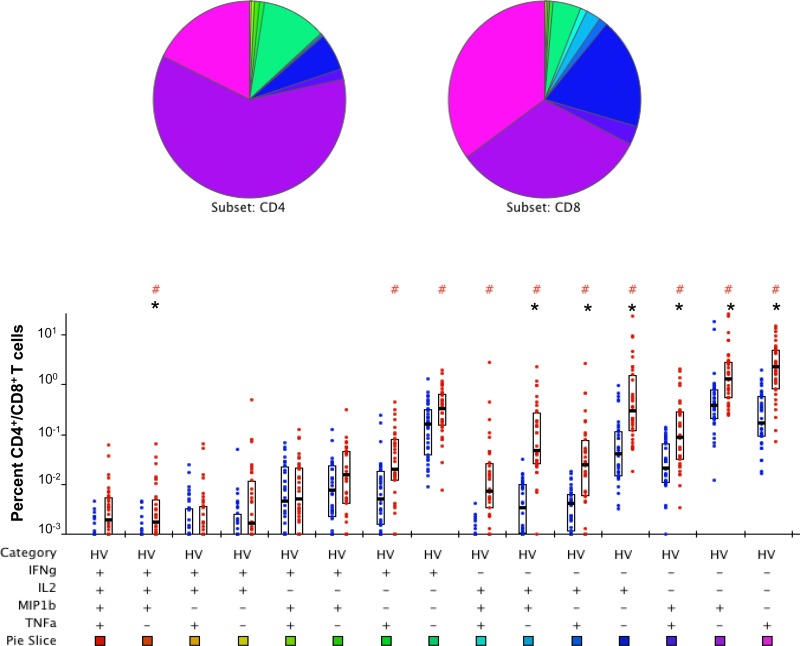
FIG 3.
Polychromatic flow cytometry analysis of cytokine production profiles of Rv1860-derived peptide-specific T cells from latently M. tuberculosis infected volunteers (HV). Whole-blood ICC samples stimulated with a mixture of peptides 1803, 1821, and 1826 were stained and analyzed as described in Materials and Methods. Percentages of CD4+ (left bar in each pair) were compared with those of CD8+ (right bar in each pair) T cells secreting the different combinations of cytokines IFN-γ, IL-2, TNF-α, and MIP-1β indicated below the pairs of bars as + or − signs. The boxes represent the 25th and 75th percentile values, and the bars denote medians. Dots represent individual values. #P values computed by the nonparametric Wilcoxon test for significant differences between CD4+ and CD8+; *significant P values below the Bonferroni-corrected critical value of 0.05/15 = 0.0033.

